On Xcode 13 incremental builds for our app took between 10 and 20 seconds on an M1 Max. Not great, but workable. After updating to Xcode 14, incremental build times now take 200 seconds at least. So it's about 10 to 20 times slower now. This makes working with the swift parts in our app pretty much unusable.
Is this another case of a swift regression that we can't do much about or is there something we do about this ourselves?
Similar problem here. With just a slightly modification on my Swift project, incremental build on Xcode 13 takes about 10 seconds to complete, but on 14, every time it takes at least 20 seconds.
I have a project where this is happening, but I cannot share it due to confidentiality; but it's a few thousand swift files and a few thousand objective-c files
I can provide (stripped) log files
Any change triggers this issue, even a single character edit in any random file.
It doesn't seem to be a full rebuild, since those are a bit slower also
One thing I noticed is that Xcode 14 never seems to use all available cores anymore. Xcode 13 was happy to get all cores going and in turn spin up the fans for a short while
If there's anything I can provide to solve this, I would be glad to help. It's currently causing hours of wasted time in our company. We're almost thinking of downgrading to Xcode 13 again
I have a log now with the extra info and I've uploaded it to Feedback Assistant FB11643909 . Would that work or do you prefer to receive it via another channel?
Thanks for the bug report. Just two other requests:
Please also attach a build timeline showing both a clean and incremental build. In Xcode, you can do this with Product>Perform Action>Build With Timing Summary
Please also add -stats-output-dir /tmp/compiler-perf to OTHER_SWIFT_FLAGS, zip up, and send us the resulting directory.
It looks like for my project, the major cause of slow incremental build on Xcode 14 is caused by the “emit module” step (pic 2), where on Xcode 12 (pic 1), there's no such step. Also, I'm not sure if "planning framework/module target" on incremental build is also new to Xcode 14. If I can minus the time those 2 steps take, the build time would be reduced to just about 12 seconds, which matches Xcode 12 and 13 results.
It wasn't clear if you were talking to both of us, but I've updated with a slow clean build with the stats. I'll try again tomorrow to get a fast clean build (whatever's causing it seems to reset after a time but I can't figure out how to reset it manually) with stats to compare.
We're running into very similar issues with Xcode 14 and slow incremental builds in one of ours apps. We've gathered the data requested in this thread and filed FB11677239. Hope it helps!
Ive been having awful problems with a swiftUI app - Xcode14.01 is continually spamming ports - am up to 218,000 currently. Have to shut down every hour. Doesn't happen on every app and doesn't happen in Xcode 13. Any ideas? By the way - they need to stop developing new features and just fix what they have got. Make it simple and just work. Its with worst IDE for stability I have every used.
Not wanting to clutter the forums with axe-grinding, have those of you who are encountering this problem considered trying this approach to avoiding long builds:
Due to recent changes, it's simpler than ever to use. Add "-Xlinker -interposable" to your projects "Other Linker flags" and either download one of the recent binary releases of the InjectionIII app then add this line to run when your program starts:
or, if binary releases aren't your boss' thing you need only add the HotReloading Swift Package to your target while you are developing.
After this, when you save a source file in your home directory it will be recompiled and dynamically loaded into the program without having to rebuild/restart. It will then run as if the modified source had been built into your app. There are limitations such as you can't add, remove or re-order properties or methods over an injection, it doesn't currently support Bazel and you need to find a way the new version of the code will be called before you'll see anything happen (such as a user action or some of the techniques described in the project's README).
I've written about this form of "conversational programming" in the past and it is quite a departure from how we've got used to doing things. Even if you only use it until they sort out the build system in Xcode 14, why not give it a try?
I had a look and it appears the incremental build only rebuilds one file and only a third of a second total is spent in the compiler. It sounds like there's something else going on with the Xcode build system here.
Just wanted to weigh in here as well. I also work on a relatively large project with several thousand files of mixed Swift/ObjC code within an Xcode workspace. Our experience with Xcode13 was really positive, it seemed to do a great job compared with previous versions of Xcode of allowing for fast incremental builds, where if one file was changed, our edit-run-debug cycles were quite fast. Xcode14 has so far been a big step backwards in supporting fast incremental builds, and it frequently takes several minutes to rebuild after a one-line change to a pretty isolated file. I will try to provide some feedback similar to what has been suggested above with capturing extra logs, but wanted at least to echo some of the other observations people have made here.
Just wanted to add that my organization's project is also going through this issue, we have reverted back to Xcode 13 because incremental builds went from 1.5min ~ to ~6min in Xcode 14.0.1 and 14.1.
Has anyone found an actual workaround for this issue (other than reverting to Xcode 13)?
Xcode 14.1 doesn't seem to improve things, so it sadly seems we need to prepare for at least a year of incredibly slow incremental builds with Xcode 14
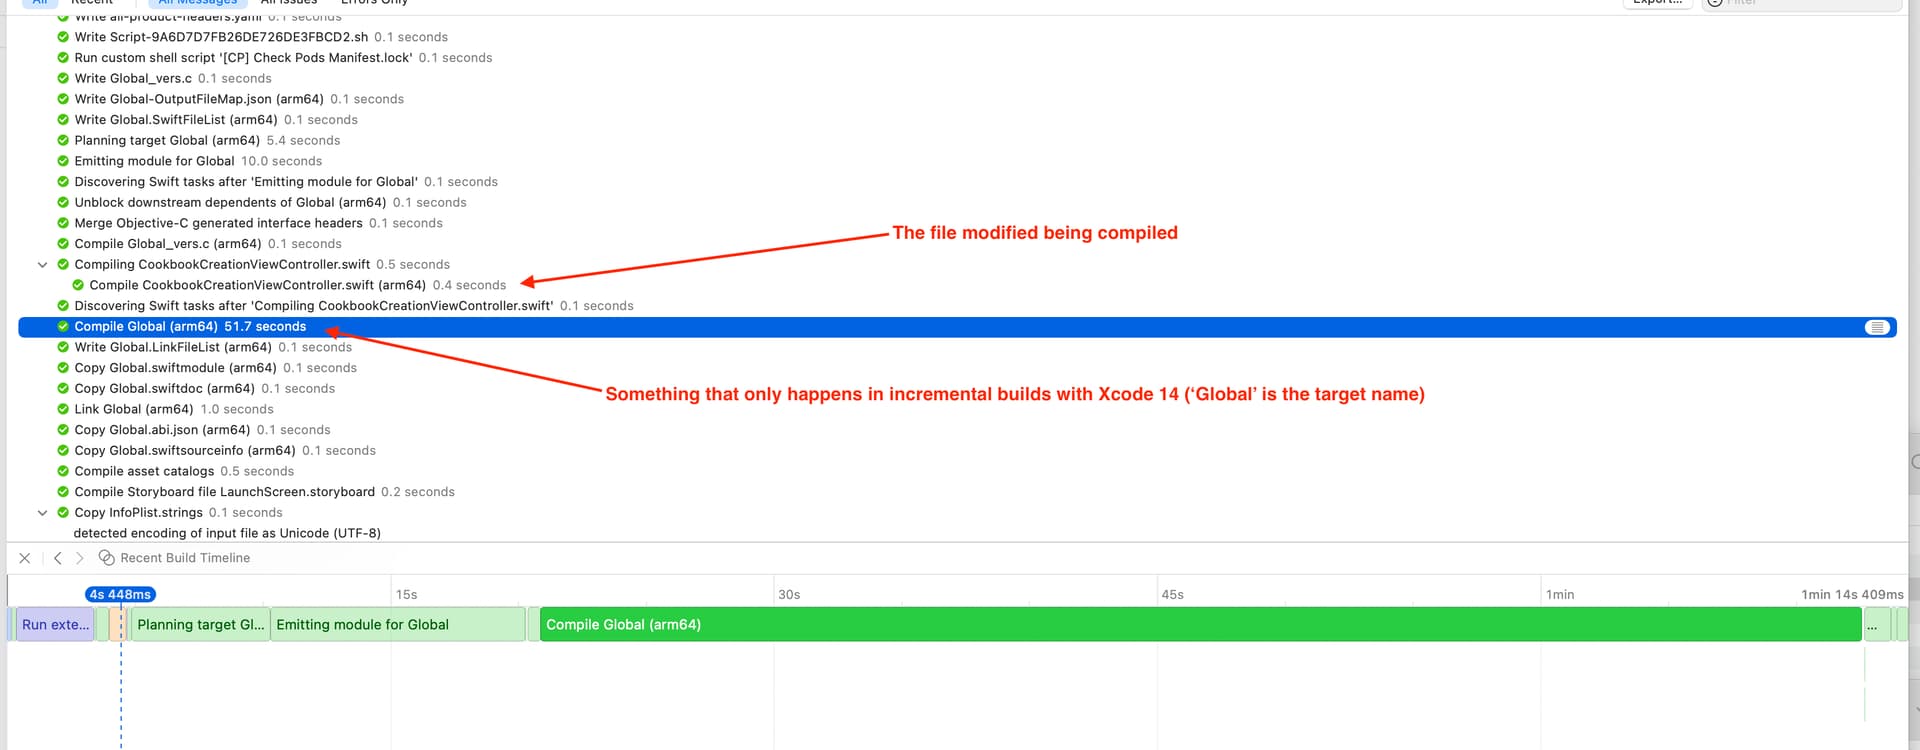
I'm not entirely sure if we're seeing the same issue described here, or something else but after moving to Xcode 14 there is some kind of bug that is adding a ~52s increase in an incremental build where I'm just making a relatively isolated one line change in a view controller.
In Xcode 13.4.1, the same incremental build takes ~23s and in Xcode 14.1 we're up to 75s which suggests that this one step is the issue. Furthermore, with the help of @Jon_Shier, I found that setting the SWIFT_USE_INTEGRATED_DRIVER build setting to NO brings the incremental build time in Xcode 14.1 back down to ~23s suggesting that the issue I'm facing relates to the new integrated driver that was added to Xcode:
Swift driver, the component that orchestrates Swift front-end invocations, is now integrated into Xcode’s build system, allowing for more fine-grained dependencies to other build system tasks and explicit scheduling. (72440175)
Here's a screenshot where you can see the problematic step:
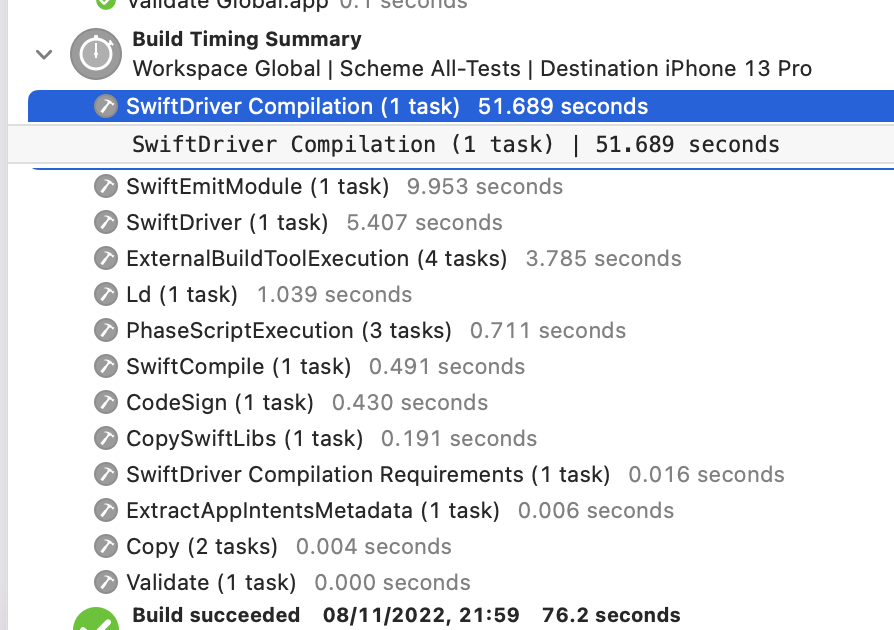
In my best attempt to try and recompile only the Global (this is the main iOS app) target and not the dependencies, I deleted Build/Intermediates.noindex/Global.build, Products/Debug-iphonesimulator/Global.app and Products/Debug-iphonesimulator/Global.swiftmodule and re-built the project. This took a total of 68.4s. (less than the 75s incremental build) where the exact same problematic 52s invocation from above took only 0.1s
I guess that one of my questions here is "what is the difference between 'SwiftCompile' and 'SwiftDriver Compilation'? I have no idea if the above is helpful, but I hope it might be.
@Slava_Pestov, @codafi: I attached logs and screenshots to FB11768802 and while I can't share the project source, neither do I know how to create a reproducer, I would be happy to jump on a video call to show you the issue if it helps.