After adding or removing this setting you should clean build folder (CMD+Shift+K). Otherwise code changes could be ignored.
1 Like
I found that it could be caused a missed dependency for an SPM internal module. Swift itself somewhat trying to solve this situation implicitly at a build rather than fall with appropriate error, and this looks like a trade off for that.
Came to this forum post after suffering slow build times for months... since the original post is quite dated by now, does anyone know if the issue was officially recognized and has a planned fix in a future version of Xcode?
...and thank you, I cannot stress how ridiculously slow build times had gotten for our project. Definitely non-linear increase for each new Swift file added to the existing mix of Obj-C and Swift files.
We are also suffering from this, when compiling our project, XCBBuildService seems to be leaking memory. After enough builds, the process takes dozens of GBs in our project.
We are experiencing this in Xcode 14.3.1 and Xcode 15 Beta 1. When this happens and memory pressure is high, the plan build step that usually takes <10 seconds after the caches are warm can take up to 10 minutes in some extreme cases.
What we've done to mitigate this (along with other things only relevant to our project) is to:
- Monitor the XCBBuildService and restart it when it's using too much memory.
- Remove local packages added to our project.
Our project is pretty complex and has > 150 SPM dependencies (a mixture of local and remote dependencies). Unfortunately, we cannot share the project.

2 Likes
We just discovered another huge source of poor build performance: the Module Validation step. As framework developers this feature seemed like a good addition, but it ends up introducing large, unexpected delays. The moment we disabled this feature in Debug builds, compilation times for individual files became far more predictable and fast.
What do you mean by Module Validation, I can't find any reference to that anywhere online or in Xcode.
It's a new feature of Xcode 14.3, mentioned in the release notes, and controlled by the "Enable Module Verifier" build setting in Xcode. It doesn't seem that useful for Swift but could help with C-family modules. However, it's both slow, as noted, and doesn't like some typical usages, like test-only frameworks (it doesn't like XCTest linking).
We are also seeing issues in the prepare and plan build steps. Our project has a large number of SPM targets (around 20 dependencies, but over 300 targets between local and remote packages). I filed FB12248864 and reported it to Xcode engineers during WWDC, who acknowledged this is not the expected behavior.
I took traces of XCBBuildService of the build plan step with Instruments and noticed that for incremental builds (where no code changes have been made), the biggest bottlenecks seem to be dealloc methods. For example, here is a screenshot when I focus on XCBCore.Settings.deinit and invert the call tree:
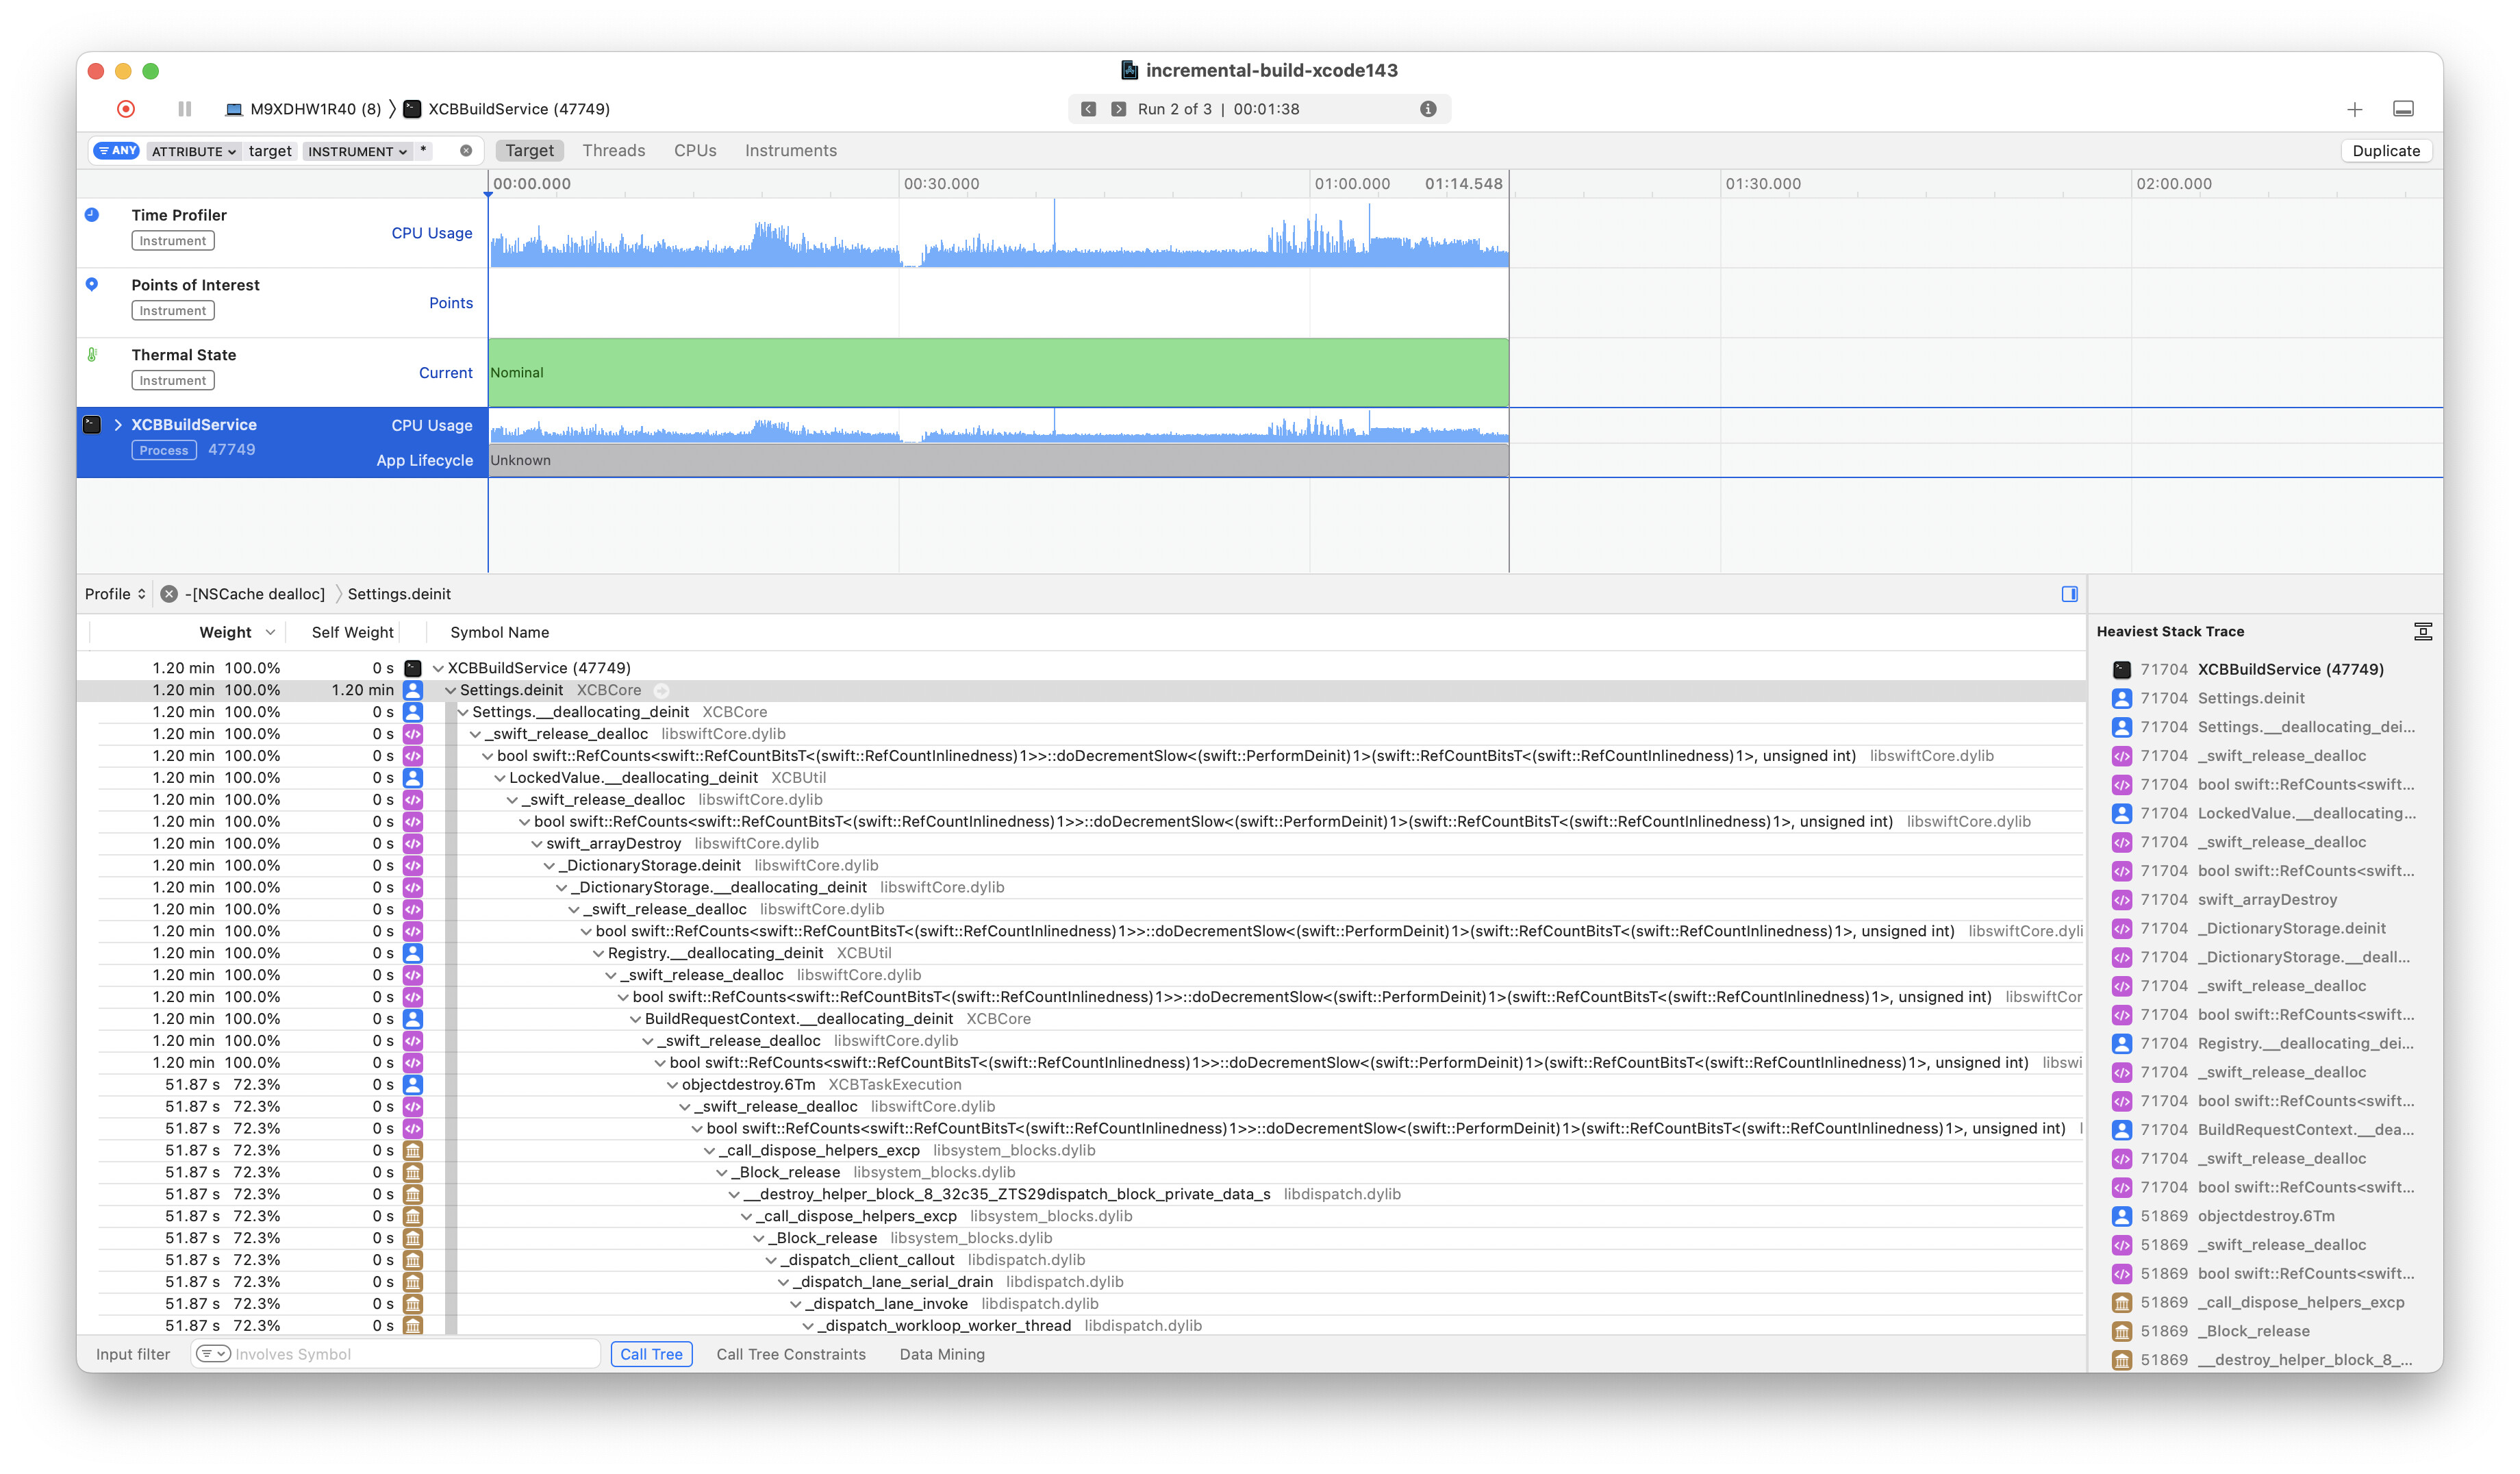
With 1m12s in a dealloc method I am almost questioning whether this measurement is correct. What I suspect is the actual work for the plan build step is only taking a few hundred milliseconds:

1 Like
That does seem surprising! Thanks for filing this ![]()
1 Like
Thank you! The traces are attached in that feedback report, and I'd be more than happy to provide any other data that can help investigate the issue.
2 Likes
Hi, any updated for it? Still suffering with the Xcode build time ![]()
3 Likes
With Xcode 15 beta 2 I sometimes (not often) get faster build times.
Running the Time Profiler I can still see a large amount of time being spent in dealloc of various objects (Cache, StackedSearchPath,FilePathResolver, HeavyCache and ValueWrapper which all seem to be defined in XCBUtil).
I attached the new traces to FB12248864 as well. I will keep you posted if I get a response there.
2 Likes
Seeing extremely slow and unpredictable build times with Xcode 15 Beta 2 too... with the following options enabled for insight:
OTHER_SWIFT_FLAGS = $(inherited) -Xfrontend -warn-long-function-bodies=200 -Xfrontend -warn-long-expression-type-checking=200
...it is clear that the compiler is taking wildly different times to compile the same sources, as if frequently blocked. To think I upgraded to Xcode 15 to get away from this very same issue ![]() and it seemed to be solved in Beta 1. Does anyone know if the
and it seemed to be solved in Beta 1. Does anyone know if the SWIFT_USE_INTEGRATED_DRIVER=NO option is still supposed to have any side effects in Xcode 15?
Update: problem persists in the just-released Xcode 15 Beta 3.
I've been testing Xcode 15 beta 3 and 4 and for me the performance has increased dramatically. In particular, incremental builds seem to be much better at avoiding rebuilding targets that have not been modified.
I can't say with 100% confidence that the memory issues I've seen before in XCBBuildService are completely gone, but so far this is a huge improvement over Xcode 14.3.
The FB I filed has not been updated yet, but if anyone at Apple is reading this and made some contribution in this area, I just want to say thank you!
8 Likes
Incremental builds have been killing me for weeks. Then I performed some Xcode hygiene and that made a huge difference.
- Are you running Xcode from Applications and is it called Xcode.app?
- Are you using Sourcetree with Use System Git pointed to the git in /Applications/Xcode.app/Contents/Developer/usr/bin ?
- Does your shell script make it easy for Xcode to find what it needs? (these are my .zshrc lines 1 and 2):
export PATH="/Applications/Xcode.app/Contents/Developer/usr/bin"
export PATH="$HOME/bin" - While you're at it, check that Xcode/Settings/Locations has the appropriate Command Line Tools.
I've filed FB12192580 and attached spindumps.
I have noticed a few things. First, "Computing target dependency graph and provisioning inputs" and "Create build description" often take long and inconsistent amounts of time. For example, one incremental build took 80 seconds. The next incremental build took 19 seconds.
Second, I noticed in one instance two XCBBuildService processes running that consumed 28GB and 23GB of memory.
Third, deleting ModuleCache.noindex and SymbolCache.noindex in Derived Data alleviates this issue, but it returns.
Finally, the issue seems to return when I open a second Xcode workspace that uses the same remote and local Swift packages the first workspace does (I close the first workspace, quit Xcode and open the second).
3 Likes
To the Apple engineers and their managers wandering through this thread, I cannot emphasise enough the social impact of the quality of the developer tools. I'd comfortably wager that hundreds of thousands of people around the world use it daily to make a living for themselves and their dependents. Trying to do so with an IDE that struggles to do things that seemed to be working well enough a year ago is incredibly frustrating. It results in underperformance and restricts what we can do. It is psychologically draining and detrimental to mental health. It slows teams trying to deliver features to users. It slows businesses from growing, competing and financially surviving. To put it poetically, this last year with Xcode could be likened to an emotionally abusive relationship.
I appreciate one does not simply build an IDE. I also acknowledge these regressions suggest attempts at technical innovation. But Apple really needs (or needs to review) quality benchmarks and hold themselves to higher quality standards. Given how common these complaints are within the community, I would be incredibly surprised if these issues with Xcode could not be reproduced internally. Apple's building was apparently designed to facilitate collaboration. Please, go and collaborate! I do not care anywhere near as much about variadic generics as I do about, say, building and running consistently taking a reasonable amount of time and resources. Please, do something about it.
19 Likes
If someone who has updated Xcode 15 and Ventura 13.6 looking for a very long build time problem, my case might be helpful for it.
In my case a build time of Xcode took about 40mins after Xcode update, and I tried to figure out what is a cause of problem.
My problem was caused by very long method (about 500 lines), and I split it then a build time problem solved.
I don't know exactly why that happened technically but I had no problem in Xcode 14 with same code.
Maybe something had changed in swift compiler but I don't know. Cuz I'm done with it. haha
I completely agree with this comment. Do something about it apple.
Agreed. Seem Apple don't care about the complaint from the socials. Not just about the build time of Xcode and the problem related to Simulator turn to black screen when do the incremental build already complaint very long time ago but still don't see them mentioned as fixed anywhere in a new Xcode release noted versions. And every time new MacOS updated, Apple will not support the old Xcode version, I know we have a way to workaround for it, but it really frustrated for dev.
And finally without official mentioned those problems in the release noted then we cannot just try to upgrade new Xcode version for our project just to find a luck for the existing problem.
2 Likes