Need help to invesigate a possible stack overflow issue

After upgrading to macOS 13.2.1 and Xcode 14.2, I find my app crashed due to a memory error:

Thread 7: EXC_BAD_ACCESS (code=2, address=0x70000be7cfb0)

The crashed can be reproduced consistently. It occurred in an async func. My app uses only value types in my own code (including that async func). While the internals of that async func are complex, it's simple from architecture perspective: a) it doesn't interact with other parts of the code, b) it generates a value and returns it to main thread.

So I have no idea how it could have memory error. My only hypothesis is that is might be a stack overflow issue. The hypothesis are supported by the following observations:

  • The app crashed only in simulator but not on my phone (maybe because worker threads on iOS has larger stack size than that on my laptop, which has Intel CPU? Or maybe the same data has different representation on the these two architectures?)

  • If I changed the async func to a regular func and call it in main thread, it works fine. (perhaps because main thread has larger stack size?)

But I'm not sure, because as I said above my app uses only values types. Since array and dictionary put most of its data in heap, I doubt if it's reallly a stack overflow issue even if worker threads has smaller stack size. Also, to address the issue, I need to find the func in which the stack overflow occurs (the async func calls a lot of funcs indirectly).

I tried to use MemoryLayout.size(ofValue:) to print local variable size, which doesn't help. I wonder what's the approach to investigate such an issue? Any sugggestions would be much appreciated.

BTW, I ran into the issue in my app at first. Then I wrote a test to reproduce the issue. The test calls that async func, which is an API of a non-ui library in my app. I also wrote another test to call an async func to returns an array (or a dictionary) of 8M size. The latter test couldn't reproduce the crash (as expected).

1 Like

Have you tried running with the address/thread sanitizers?

1 Like

Thanks for the suggestion. I didn't (I used it in my another app once but completely forgot it). It's late night here. Will try it tomorrow and let you know the result.

1 Like

Hi @hassila I tried address and thread sanitizers. They didn't report any error. An interesting detail: If I enabled both address sanitizer and malloc scribble options, the crash was gone (otherwise the crash persisted). So adding debug code might change the binary's behavior.


Below are my other findings and how I worked around the issue.

TLDR: vmmap output suggested there was no stack overflow in the thread that crashed. So I worked around the issue by modifying my code.

I found this thread. There are a lot of useful information in it, though none are particular helpful in this case because no one mentioned how they knew for sure it's really a stack size issue. I ended up with using vmmap to check stack size of the xctest process after it crashed:

$ vmmap $(pgrep xctest) | grep -i stack
...
Stack                    70000f47f000-70000f501000 [  520K    40K    16K     0K] rw-/rwx SM=COW          thread 1
Stack                    70000f502000-70000f584000 [  520K    88K    80K     0K] rw-/rwx SM=COW          thread 3
Stack                    70000f585000-70000f607000 [  520K   324K   324K     0K] rw-/rwx SM=COW  
Stack                    70000f608000-70000f68a000 [  520K    16K    16K     0K] rw-/rwx SM=COW          thread 4
Stack (reserved)         70000f68b000-70000f70d000 [  520K     0K     0K     0K] rw-/rwx SM=NUL          reserved VM address space (unallocated)
Stack                    7ff7be516000-7ff7bed16000 [ 8192K    96K    96K     0K] rw-/rwx SM=COW          thread 0

Notes:

  • thread 4 is the thread that crashed.
  • thread 0 is the main thread, with 8M stack size
  • there is one line without thread name. I suppose it's thread 2. Not sure why it used so much space in the stack (the thread has a different name than 'cooperative thread', but I forgot the details).
  • the output varied in each run, but the crashed thread's stack size never exceeded 16k.

Memory metrics are known to be hard to interprete. But if my understandinng is correct, the above output showed that there was no stack size issue when the crash occurred.

Then I started to think about workaround. The crash always occurred in a specific part of the code. I didn't pay much attention to it at first because I think memory error crash could occur at any place. The code is a custom iterator which iterates multiple arrays at the same time and chooses one at a time based on rules. I have looked at the code a lot of times these two days but really can't find any issue in it (it worked fine on my phone anyway). I also find the following in official doc, I don't think I did anything wrong in my code:

Using Multiple Iterators

Obtain each separate iterator from separate calls to the sequence's makeIterator() method rather than by copying. Copying an iterator is safe, but advancing one copy of an iterator by calling its next() method may invalidate other copies of that iterator. for-in loops are safe in this regard.

I ended up by removing the custom iterator and the crash was gone (no idea why).

FWIW, these are details of the crash
  1. The crash occurs at the this instruction in most cases:

-> 0x10013abeb299 <+41>: callq 0x10013a930da0 ; type metadata accessor for acdbCN.SomeDailyCEW at

The 0x10013a930da0 is a valid address (I can dissemble it).

The correspoding line in the source code is just a assignment (both sides are local variables of value type) that is impossible to fail.

  1. The topmost frame of the stack trace is some like:

outlined assign with take of SomeDailyCEW?

SomeDailyCEW is a type in my code. I think it corresponds to the assembly code above.

  1. The error message is something like:

Thread 7: EXC_BAD_ACCESS (code=2, address=0x70000be7cfb0)

The 0x70000be7cfb0 is a mystery. It has nothing to do with the above addresses (neither the current address nor the address to jump to).

Without the knowledge of compiler internals and the LLVM, this is the best I gathered.

"We don't solve problems. We survive them." :)

2 Likes

Perhaps you could show the fragment related to the iterators that you think is suspicious, we may sport something offhand.

I'd be very careful and not cause this bug to disappear... It's very good the issue is reproducible and this is what I'd to to actually track it: once you run out of other ideas – remove everything unimportant, module by module, file by file, function by function, line by line – at every step making sure that the bug is still there. If it disappears – backtrack, undo the last change, make sure the bug is not lost and continue removing something else. By the end of this elimination process you'll end up with a perfect minimal example, perhaps a few lines – at that point it would be obvious what's going on and how to best fix it.

1 Like

remove everything unimportant, module by module, file by file, function by function, line by line – at every step making sure that the bug is still there. If it disappears – backtrack, undo the last change, make sure the bug is not lost and continue removing something else. By the end of this elimination process you'll end up with a perfect minimal example

A great tool for this (if your initial reproduction case can be a single source file) is creduce. It essentially just removes parts of your code and rearranged things until the bug stops happening. You just need to ensure that the evaluation script you give it is specific enough ti ensure that you don’t end up with a different bug by the time creduce is finished.

Essentially, your evaluation script should just use grep to check the output of running the test case for a specific identifying string from the initial error message.

Happy to help if you need. Feel free to send your initial single file reproduction case if you manage to make one but can’t get creduce working.

Of course, if it’s simple enough you can just reduce the case manually easily enough, but I find creduce quite fun and it’s usually faster in my experience :)

2 Likes

@tera, @stackotter, thanks for the suggestion. creduce sounds like an interesting tool. I'm not sure if it's helpful in this case, but I hope I'll find a use case in future and figure out how it works.

Just FYI, I made some progress in investigating the crash. below are the details.

First I want to explain, while I said the issue can be reproduced consistently, I didn't mean the behavior is fixed, it's actually dynamic. The async func in the test calls an API of my library. The API takes raw data in and returns processed data. The raw data are processed in multiple rounds. Each round contains many steps and in one step I use for loop. That's where the custom iterator comes in. While the crash always occurred in the custom iterator initialization code, it's random in which round the crash occurred. That is, the iterator worked fine in some rounds and then it crashed. This is what I mean by 'dynamic'.

The issue isn't in the logic of the custom iterator code (BTW, I didn't show the code because it isn't implemented as a general utility. It depends on other code in my library. I could write a simplified standalone version. I didn't do it because I doubted it was that part of the code that caused the issue). The issue is in an enum variable assignment code in the custom iterator code. Please read on.

It's a stack overflow

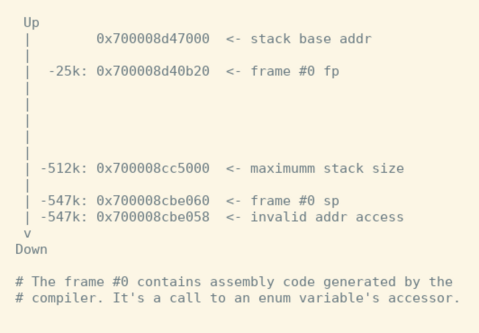
See log below. The address that caused the crash is 0x700008cbe058.

(lldb) thread backtrace
  * thread #4, queue = 'com.apple.root.default-qos.cooperative', stop reason = EXC_BAD_ACCESS (code=1, address=0x700008cbe058)
  * frame #0: sp=0x0000700008cbe060 fp=0x0000700008d40b20 pc=0x0000000139b853e9 acdbCNTests`outlined assign with take of SomeDailyCEW? + 41 at <compiler-generated>:0
    frame #1: sp=0x0000700008d40b30 fp=0x0000700008d422a0 pc=0x000000013a92b052 acdbCNTests`DDCEWGroupViewIterator.consumeNext(self=acdbCN.DDCEWGroupViewIterator @ 0x00007f84d3022810) + 642 at cewViewMapT+iterator.swift:156
    frame #2: sp=0x0000700008d422b0 fp=0x0000700008d422b0 pc=0x000000013aacc6a9 acdbCNTests`protocol witness for CEWViewIteratorP.consumeNext() in conformance DDCEWGroupViewIterator + 9 at <compiler-generated>:0

    ...

From vmmap output, the valid address of that thread's stack is in 700008cc5000-700008d47000. The above address is outside the range.

Stack                    700008bbf000-700008c41000 [  520K    40K     8K     0K] rw-/rwx SM=COW          thread 1
Stack                    700008cc5000-700008d47000  [  520K   184K   184K     0K] rw-/rwx SM=COW  
Stack                    700008d48000-700008dca000 [  520K    16K    16K     0K] rw-/rwx SM=COW          thread 3
Stack                    700008dcb000-700008e4d000 [  520K    16K    16K     0K] rw-/rwx SM=COW          thread 4
Stack                    7ff7ba447000-7ff7bac47000 [ 8192K    96K    96K     0K] rw-/rwx SM=COW          thread 0

This diagram summarized the the relation of those addresses. Note that frame #0 has a very large size.

tmp1

The assembly code of frame #0

Out of curiousity, I looked at the assembly code and managed to add some annotations (those lines starting with #).

acdbCNTests`outlined assign with take of SomeDailyCEW?:
    # Save fp
    0x139b853c0 <+0>:       pushq  %rbp
    # Copy sp to fp
    0x139b853c1 <+1>:       movq   %rsp, %rbp
    0x139b853c4 <+4>:       pushq  %r14
    0x139b853c6 <+6>:       pushq  %rbx
    # Increase stack size by subtracting a constant from sp:
    # sp's origal value can be read from fp. It's 0x0000700008d40b20
    # so sp's new value is: 0x0000700008d40b20 - 0x82ab0 = 0x700008cbe070
    # the calculated value has a small difference with the actual value
    # (0x0000700008cbe060). Not sure why (maybe alignment?).
    0x139b853c7 <+7>:       subq   $0x82ab0, %rsp            ; imm = 0x82AB0
    0x139b853ce <+14>:      movq   %rdi, -0x50(%rbp)
    0x139b853d2 <+18>:      movq   %rsi, -0x48(%rbp)
    0x139b853d6 <+22>:      movq   %rsi, %rax
    0x139b853d9 <+25>:      movq   %rax, -0x40(%rbp)
    0x139b853dd <+29>:      movq   %rdi, -0x38(%rbp)
    0x139b853e1 <+33>:      movq   %rsi, -0x30(%rbp)
    0x139b853e5 <+37>:      xorl   %eax, %eax
    0x139b853e7 <+39>:      movl   %eax, %edi
    # This caused crash, because the sp adress is invalid.
->  0x139b853e9 <+41>:      callq  0x1398caef0               ; type metadata accessor for acdbCN.SomeDailyCEW at <compiler-generated>

The mysterious piece of code:

0x139b853c7 <+7>:       subq   $0x82ab0, %rsp            ; imm = 0x82AB0

$0x82ab0 is larger than 512k, so no doubt the code crashed.

As I explained earlier, my code worked in multiple rounds and the crash occurred after some rounds. So it's likely that those earlier rounds called a (or multiple?) different version of the above code, which used a smaller constant. How this exactly works under the hood is a mystery to me.

My code uses value of large size (though I wrapped them in arrays and dictionaries). The above code is called when I set an enum variable, which has associated value of large size. I suspect this may cause the crash.

That is all. There are a few things I'm thinking to do:

  • Remove the enum in my iterator code and see it makes a difference. I haven't thought out a simple way to do it though.

  • Test my workaroud code in which I remove all the iterator code. And use vmmap to monitor its stack usage. If it's always below, say, 20K, then it's not a workaround, it's a fix :)

  • Write a test to assign an enum variable with a large array or dictinary and see if I can reproduce the crash.

I have run into a crash related to this recently. Could you please send the function that is crashing? (It's fine if I can't run it) Maybe also include some code around the function if you think it's relevant. My theory is that the issue is happening because of assigning to uninitialised memory incorrectly (easy mistake to make)

Thanks for your help! Please see the code below.

Background: I have a struct containing a few dictionaries. These dictionaries are of different types. I wrote an iterator to walk through these dictionaries at the same time and pick one or multiple values at a time base on some rule.

(Note: the above is a simplification. In the actual code, each dictionary's values contains an array. The custom iterator iterates arrays embedded in all different dictionaries' value at the same time. But that's a detail I think can be ignored, because the crash always occurs in a helper struct, which I'll describe below).

For each dictionary (note they are of different types), I introduced a helper struct. The helper struct does the following: a) it wraps the dictionary's builtin iterator, b) it added a peek() API. This is necessary because the rules need to peek the value first to make decision. c) it wraps the value in an enum so that the custom iterator doesn't need to deal with different types.

The code:

  • FICEWGroupViewIterator is the helper struct. There are other help structs. All have the same code structs.
  • SomeDailyCEW is the enum that these helper struct's peek/consume() api returns.
  • I defined a protocol CEWViewIteratorP so that I can put all these helper structs in a single array. See CEWViewMapIterator.iterators
  • CEWViewMapIterator is the custom iterator. Its init() initializes these helper structs.

(Note: the "view" in above names has nothing to do with SwiftUI.)

The crash always occurs at this piece of the code. The slot.value is valid when the crash occurred.

        if let slot = iterator.next() {
            next = .fi(slot.value)      <= this often caused crash
        } else {
            next = nil     <= this occasionally caused crash too.
        }

Below contains most code. I really can't see how it's an initialization issue. Let me know if you need more information. I'm getting offline soon. Thanks!

public enum SomeDailyCEW {
    case dd(DDDailyCEW)
    case td(TDDailyCEW)
    case fi(FIDailyCEW)

    var date: DateOnly {
        switch self {
        case .dd(let cewGroup):
            return cewGroup.date
        case .fi(let cewGroup):
            return cewGroup.date
        case .td(let cewGroup):
            return cewGroup.date
        }
    }
}

protocol CEWViewIteratorP {
    func peekNext() -> SomeDailyCEW?
    mutating func consumeNext() -> SomeDailyCEW
}

// Usage:
// - peekNext() can be called multiple times.
// - consumeNext() is called only if peekNext() return non-nil value.
struct FICEWGroupViewIterator: CEWViewIteratorP {
    private var iterator: IndexingIterator<[SingleValueSlot<FIDailyCEW>]>
    private var next: SomeDailyCEW? = nil

    init(_ view: FICEWView) {
        iterator = view.slots.makeIterator()

        if let slot = iterator.next() {
            next = .fi(slot.value)
        } else {
            next = nil
        }
    }

    func peekNext() -> SomeDailyCEW? {
        return next
    }

    mutating func consumeNext() -> SomeDailyCEW {
        guard let oldNext = next else { preconditionFailure("shouldn't consume next if it's nil") }

        if let slot = iterator.next() {
            next = .fi(slot.value)
        } else {
            next = nil
        }

        return oldNext
    }
}

public struct CEWViewMapIterator: IteratorProtocol {
    var iterators: [CEWViewIteratorP]
    
    init(_ map: CEWViewMap) {
        iterators = []

        map.forEach { id, uiView in
            iterators.append(DDCEWGroupViewIterator(uiView))
        } tdItem: { id, uiView in
            iterators.append(TDCEWGroupViewIterator(uiView))
        } fiItem: { id, uiView in
            iterators.append(FICEWGroupViewIterator(uiView))
        }
    }
    
    public mutating func next() -> (DateOnly, [SomeDailyCEW])? {
        // This part are just rules, which aren't important to reproduce the issue. 
        ...
    }
}

This is huge indeed.

You didn't show the structs DDDailyCEW / TDDailyCEW / FIDailyCEW, are they big?

Quite a few things are missing in your fragment, so it's not possible to compile / run it (as you indicated).
I'd stand on my recommendation to manually strip everything unimportant from the app to get the resulting few-line self contained and complete sample code that crashes. I did this many times and as this is a "logarithmic" in time process it would typically not take more than an hour or so, even with a large project.

1 Like