Make sure you report this to Apple with a copy of the project, as there may nor may not be people on these forums who can help with these issues. If you post the Feedback number those that can see it can take a look.
On a side note, it's become increasingly difficult to reliably test Xcode build performance. There are so many different caches which may or may not impact speed, and SPM throws a whole wrench into it with random resolution of packages which you hope you don't affect when deleting the other caches. Even cleaning in Xcode doesn't actually clear everything you need to replicate fully clean builds.
We use only Cocoapods for dependency management, and I was also cleaning the derived data directory manually to make sure everything is deleted.
Before posing here I was trying multiple times with different configs, I will continue my testing, but I'm not sure I can create a test project large enough where this issue can be seen.
I also tried to enable SWIFT_USE_INTEGRATED_DRIVER=YES while this still is slower then without enabling it, but now I do not see that much of difference as before.
I cant share our project but if someone would like we can have a call and try different things to understand the bug.
Apple doesn't really do calls but you can reach out to DTS, though I don't think they'd help with this. If you can't share your project privately with Apple it will be hard for them to do anything concrete here. But your experience matches what I've heard from other users when project size gets over the simplest apps.
We're always interested in improving build times. I understand that you can't share all of your code, but there are still things you can do that can potentially let us fix your problem. In particular, you may be able to isolate some code that's now significantly slower to build. This blog post seems to be a pretty complete and up-to-date exploration of how to approach this. The first thing to do is to get build timings under both releases so that you can verify that the problem is that Swift compilation is slower and it's not something more surprising in the build. Assuming it shows that the problem is indeed the Swift compiler, rebuild using the long-compile-time warnings and compare the output to see if there are functions that are significantly slower to type-check than they used to be. If there are, try to copy those functions into new projects with just as much context as is necessary to keep them slow to compile, then file bugs with those reduced examples. You can rename all of your types and methods in order to preserve any secrets you don't want to share.
As a general rule, the type-checking time of an individual function is not affected by things like other function bodies (you can replace them all with empty bodies or preconditionFailure), and it shouldn't be affected by obviously uninvolved declarations (if the function never uses the name foo, you should be able to drop any declarations like func foo()), but it can definitely be affected by declarations with the same name that aren't supposed to be used (like overloads that don't match the types involved).
If the compiler is just slower across the board without any specific functions that stand out, that's pretty much the worst-case scenario, and there's not much we can do without a complete project.
Thank you for the response, its really encouraging.
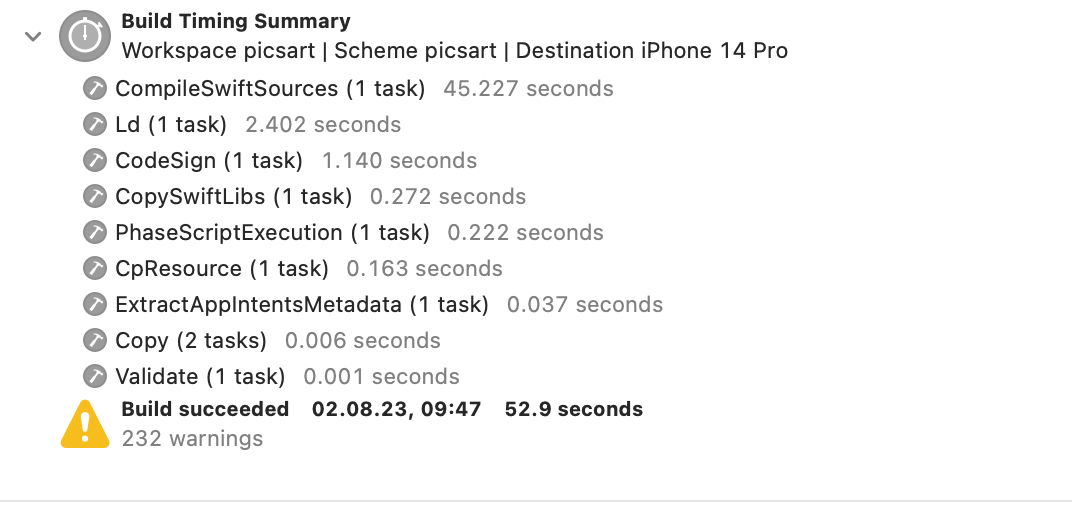
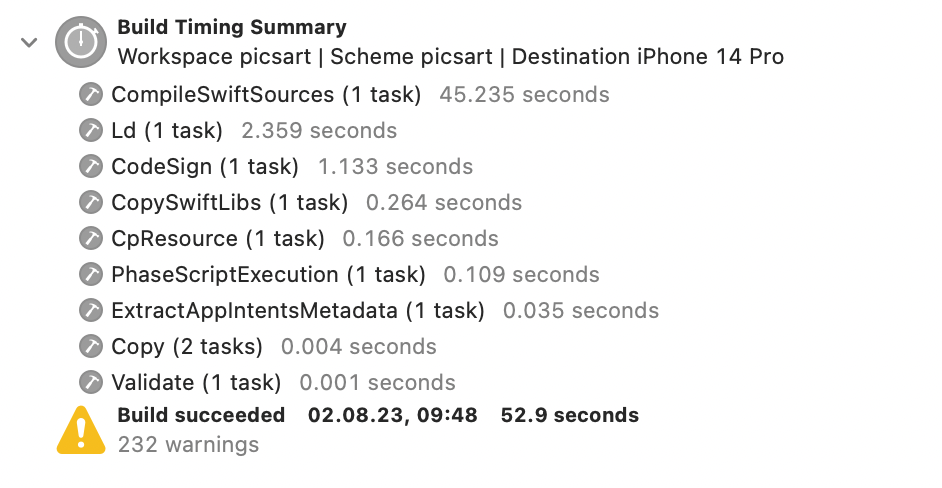
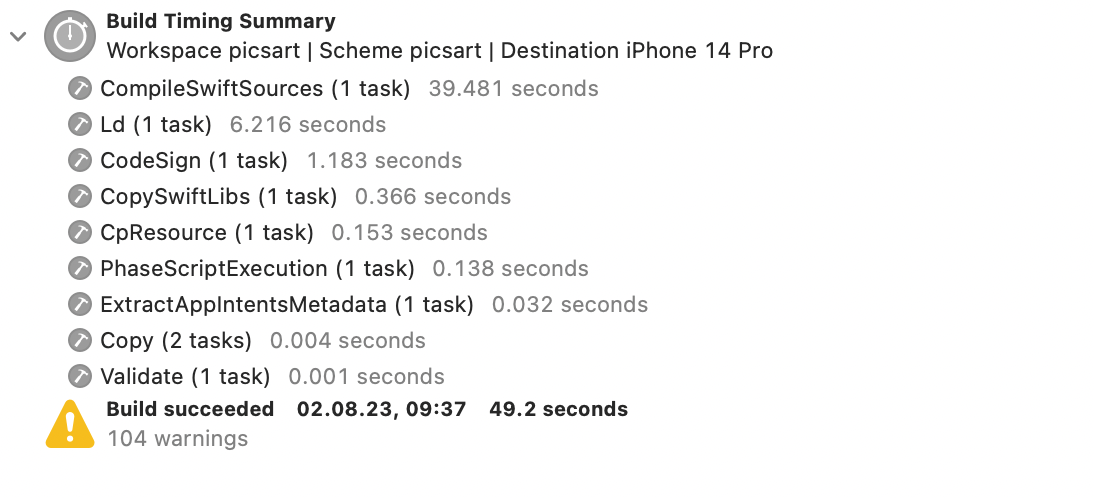
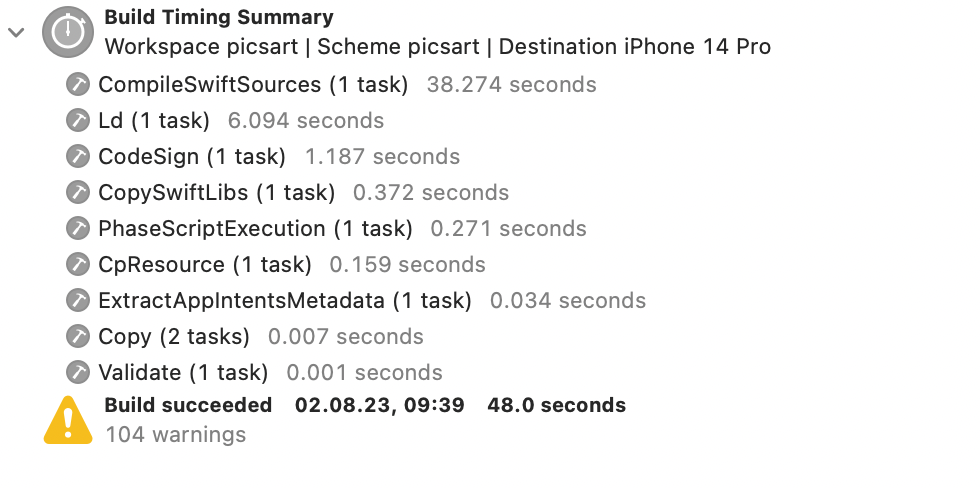
Here is my test setup - I have 2 separate clones of the project, one I use for Xcode 15, another for 14, each time before building I'm changing command line tools to the respective one ( when testing with 15 - command line tools are set to 15 ) just in case. I do incremental build and adding/removing print("hello") in the same file in the same place, I do multiple builds with both Xcode to make sure its not accidental result, trying to wait a little before building so Xcode will complete the indexing (although I could not understand if its finished or not )) ) and I'm not doing anything with the laptop during test run.
Attaching results with screenshots, tldl I got 38 sec(Xcode 14) vs 45 sec (Xcode 15)
Next I will try to use Xcode's diagnostic options and will update here the result
I have read this document besides the blog post you have mentioned, tried to pass -driver-time-compilation but didn't see anything in the console, tried with Xcode UI and Xcode build, then found this post , seems that flag is not working or might be the reason is that my compiler version is not an assert compiler ?
-stats-output-dir flag seems working but I dont know how to use it to compare the results ( data is too large).
Also tried to pass -Xfrontend -debug-time-compilation which gave build error( I think that flag might not exist anymore since I couldnt find it in this doc.
Tried to set ASSETCATALOG_COMPILER_GENERATE_ASSET_SYMBOLS=NO didnt help. (its new for Xcode 15)
Looking at build graph (attached image) seems the difference is in Emit Swift module phase (20 vs 25) and we might some difference in the empty gaps before and after CompileSwiftSource phase. Don't know if it helps.
but unfortunately on incremental builds when I add/remove only one line, no warnings are posted.
I have concentrated to incremental build because its more important for developers and since projects building slow, I practically cant test lots of cases ( it would take weeks to do that).
Is there any practice to give some apple employees private access to the github repository so they can try to debug and understand the issue?
Interestingly, you're benefitting from Xcode 15's faster linker yet that doesn't quite overcome the compiler's regression. If you do find a way to get timing diagnostics from the compiler that would be great. My investigations of compiler performance issues have never gone anywhere since I never found a way to break down performance in a way that could actually point anywhere.
If you want to give Apple access to the code, the easiest way is to simply zip up the repo (after deleting your .git directory for space) and attach it to the feedback.
We also have private dependencies and some other dependencies in nexus which could only be accessed by vpn. So providing tmp user access would be a lot simpler and faster.
We would gladly cooperate with apple if they want to fix/find the issue. I'm quite sure this it's not only our project which sees this regression.
If you're seeing a runtime regression that's a separate issue. You can create a new thread with a code sample if you'd like others to investigate, or report a bug to Apple. This thread is about build time regressions in Xcode 15.
Personally I've seen about a 10% build time regression between Xcode 14.3.1 and 15, even with the new linker in play (which, by the way, has much worse diagnostic output than the old one). There's also some sort of regression where every @_exported symbol fails to be found at link time (regardless of linker), forcing to me to link every sub dependency manually every time one of its symbols is used in my code.