I have created a small snippet and run it with /usr/bin/time -l ...
let numberOfTasks = 1_000_000 // Also with 100_000

try await withThrowingTaskGroup(of: Void.self) { group in
    for _ in 0..<numberOfTasks {
        group.addTask {
            try await Task.sleep(for: .seconds(10))
        }
    }
    try await group.waitForAll()
}
print("All tasks finished.")
with 1 million "tasks", the code used 1448 MB of RAM.
with 10k - 211 MB
runtime was much higher than 10 seconds, but it was not consistent.
I run this on M1 Max with 32GB.
Then I tried following snippet:
let dispatchGroup = DispatchGroup()
let queue = DispatchQueue.global(qos: .utility)

for _ in 0..<numberOfTasks {
   dispatchGroup.enter()
   queue.async {
       queue.asyncAfter(deadline: .now() + 10) {
           dispatchGroup.leave()
       }
   }
}

dispatchGroup.wait()
print("All tasks finished.")
Dispatch Group uses 5 times less memory and runtime is very close to 10 seconds.
I know that dispatch group and tasks are not directly comparable, and that task-groups provide additional safety and synchronisation, however, even compared to other languages' async task implementations, Swift's seems to be having higher memory and CPU overhead.
Am I doing/measuring something incorrectly?
Is there some kind of fundamental reason why it is like this, or can this be optimised and improved sometime in future?
This pattern creates and keeps numberOfTasks in memory until you start draining them in the waitForAll. You'll notice that this effectively builds up a big chunk of memory, and only afterwards it'll start going down.
This is the reason we introduced withDiscardingTaskGroup (docs, proposal) which immediately discards tasks as soon as they finish, without keeping them alive for collecting results. This is more like the Dispatch API you're comparing it with, and the others shown in those benchmarks:
try await withThrowingDiscardingTaskGroup { group in
    for _ in 0..<numberOfTasks {
        group.addTask {
          // is destroyed as soon as complete, not when awaited
        }
    }
    try await group.waitForAll()
}
print("All tasks finished.")
The difference is that the dispatch use doesn't really keep and visit every block you've created as they don't return results -- this is why it's more similar to the discarding group
I have copied your code, and I am getting 11 seconds for 10000 items, 19 seconds for 100000.
Could you add one more zero and try out?
@ktoso with withDiscardingTaskGroup memory consumption is much lower, however, it still takes lots of time to complete.
Following example takes around 100 seconds to complete on M1 Max (8 performance, 2 efficiency cores) with 32GB RAM
let numberOfTasks = 1000000
try await withThrowingDiscardingTaskGroup { group in
    for _ in 0..<numberOfTasks {
        group.addTask {
          try await Task.sleep(for: .seconds(10))
        }
    }
}
I am using macOS 26.3 and run swiftc sample.swift -Ounchecked -wmo -o to compile
swift-driver version: 1.127.14.1 Apple Swift version 6.2.3 (swiftlang-6.2.3.3.21 clang-1700.6.3.2)
Target: arm64-apple-macosx26.0
As a comparison I also run following code to see if Task creation is the problem, but it finishes in ~40 seconds
let dispatchGroup = DispatchGroup()
for _ in 0..<numberOfTasks {
   dispatchGroup.enter()
    Task {
        try await Task.sleep(for: .seconds(10))
        dispatchGroup.leave()
    }
}
Remember doing same experiments two years ago and chatting a bit with @ktoso, checking instruments and so on. As far as I remember (and could be wrong) my conclusion was Task.sleep doing basically nothing and not threads will be used, so sleeping is a useless metric in that case—and that's why it's taking 100s and etc.
It’s not about Task.sleep, but about TaskGroup’s handling of concurrent tasks. Task.sleepis just a mechanism to ensure the tasks themselves do not consume much resources and TaskGroup does not compete with them
It's not a useless metric. It's a way to measure the overhead of the concurrency runtime scheduling. In this case, any time that exceeds the 10 seconds indicates child task creation and enqueueing overhead. So for 100000 tasks, if it takes 18 seconds, then there is an 8 second overhead. For one million tasks the overhead seems to grow even further.
My take is that it's useless understanding this exact enqueueing overhead. Remember changing it to some task with some work done inside and picture was completely different.
But then again, it was two years ago and maybe I don't get some internals. Need to play a bit more.
In terms of timing, the actual cost this is observing is contention on the task lock when the tasks are all "at the same time" finishing and need to remove themselves from the task tree - this is a known thing and could be improved for sure but not removed entirely due to the structured nature of child tasks. Especially in the discarding case. You should use an actual profiler when doing those benchmarks and then you'll see what the contention points are.
If you want to measure the task creation overhead you should be measuring how long addTask takes since that is synchronously done -- that is an interesting metric as well.
Is it really measuring the scheduling overhead, though? Or is there something here related to Task.sleep specifically?
If it's the former, it should be impossible to schedule 100k tasks and take less than 8 seconds. But the following completes in just 350 ms (M1 Pro), with 100k tasks:
@_optimize(none)
func doNothing() async {
    for _ in 0..<3 {
        if Bool.random() { return }
        await Task.yield()
    }
}

let numberOfTasks = 100_000

try await withThrowingDiscardingTaskGroup { group in
    for _ in 0..<numberOfTasks {
        group.addTask {
            await doNothing()
        }
    }
}
I don't fully understand what you mean by this? You can schedule how many tasks you want since it's a synchronous operation and nothing about what you scheduled (i.e. what the tasks actually do) should affect this scheduling. So this snippet
for _ in 0..<numberOfTasks {
    group.addTask {
        // Work
    }
}
should take, as your benchmark shows, under a second or so, regardless of what the child tasks are actually doing. Then the tasks do their work, be it sleep or some real work, and then they finish. Scheduling those tasks initially can surely (and in my opinion should) take far less than 8 seconds. Depending on how quickly the tasks actually get scheduled and run affects how long we have to wait for the results.
It is measuring overall scheduling overhead. Task.sleep also incurs scheduling overhead, since it's basically just running a special job / resuming a continuation after the given amount of time. Most likely those costs (+ the apparent lock contention of task groups) are the reason for the abysmal performance in the million task case.
Just to comment on the overall issue: at first glance, if the poor performance is only due to the Task.sleep, then it doesn't seem like a big problem since real programs don't just sleep. But it is an essential part in some programs and in fact the currently pitchedwithDeadline function depends on Task.sleep cancelling the task after a given amount of time. I surely wouldn't want my tasks in a fairly busy server, written with Swift NIO and abiding by the rules of modern Swift Concurrency, to cancel some database requests after 100 seconds of the actual requested timeout.
The difference you’re seeing is mostly due to how Swift structured concurrency works compared to GCD.
• TaskGroup tasks carry extra metadata (cancellation, priority, parent-child tracking, async state), so creating huge numbers increases memory usage.
• DispatchGroup + GCD uses simpler work items, so it consumes less memory and schedules faster.
• Task.sleep suspends cooperatively, while asyncAfter uses timers — not an identical workload.
• Launching 1M tasks at once stresses the scheduler and increases runtime.
You’re likely measuring correctly — this overhead is expected.
Right. Apologies, I'm seeing some inconsistent behavior as to when Xcode decides to terminate the program (I ran the code snippet as a CLI project in Xcode), where it sometimes (but not always) waits for all tasks to complete. So for a moment I thought the child tasks were completing before the program exited too.
That said, it's not the only difference I'm seeing running the code directly in Xcode (compiled for Release) vs profiling in Instruments (or executing the binary manually). In fact, I can't reproduce the observed behavior of the original post in Instruments.
So while this takes 23s to run in Xcode (compiled for Release, 100k tasks):
import Foundation

let numberOfTasks = 100_000

let time = try await ContinuousClock().measure {
    try await withThrowingTaskGroup(of: Void.self) { group in
        for _ in 0..<numberOfTasks {
            group.addTask {
                try await Task.sleep(for: .seconds(10))
            }
        }
        try await group.waitForAll()
    }
}

print("Took \(time)")
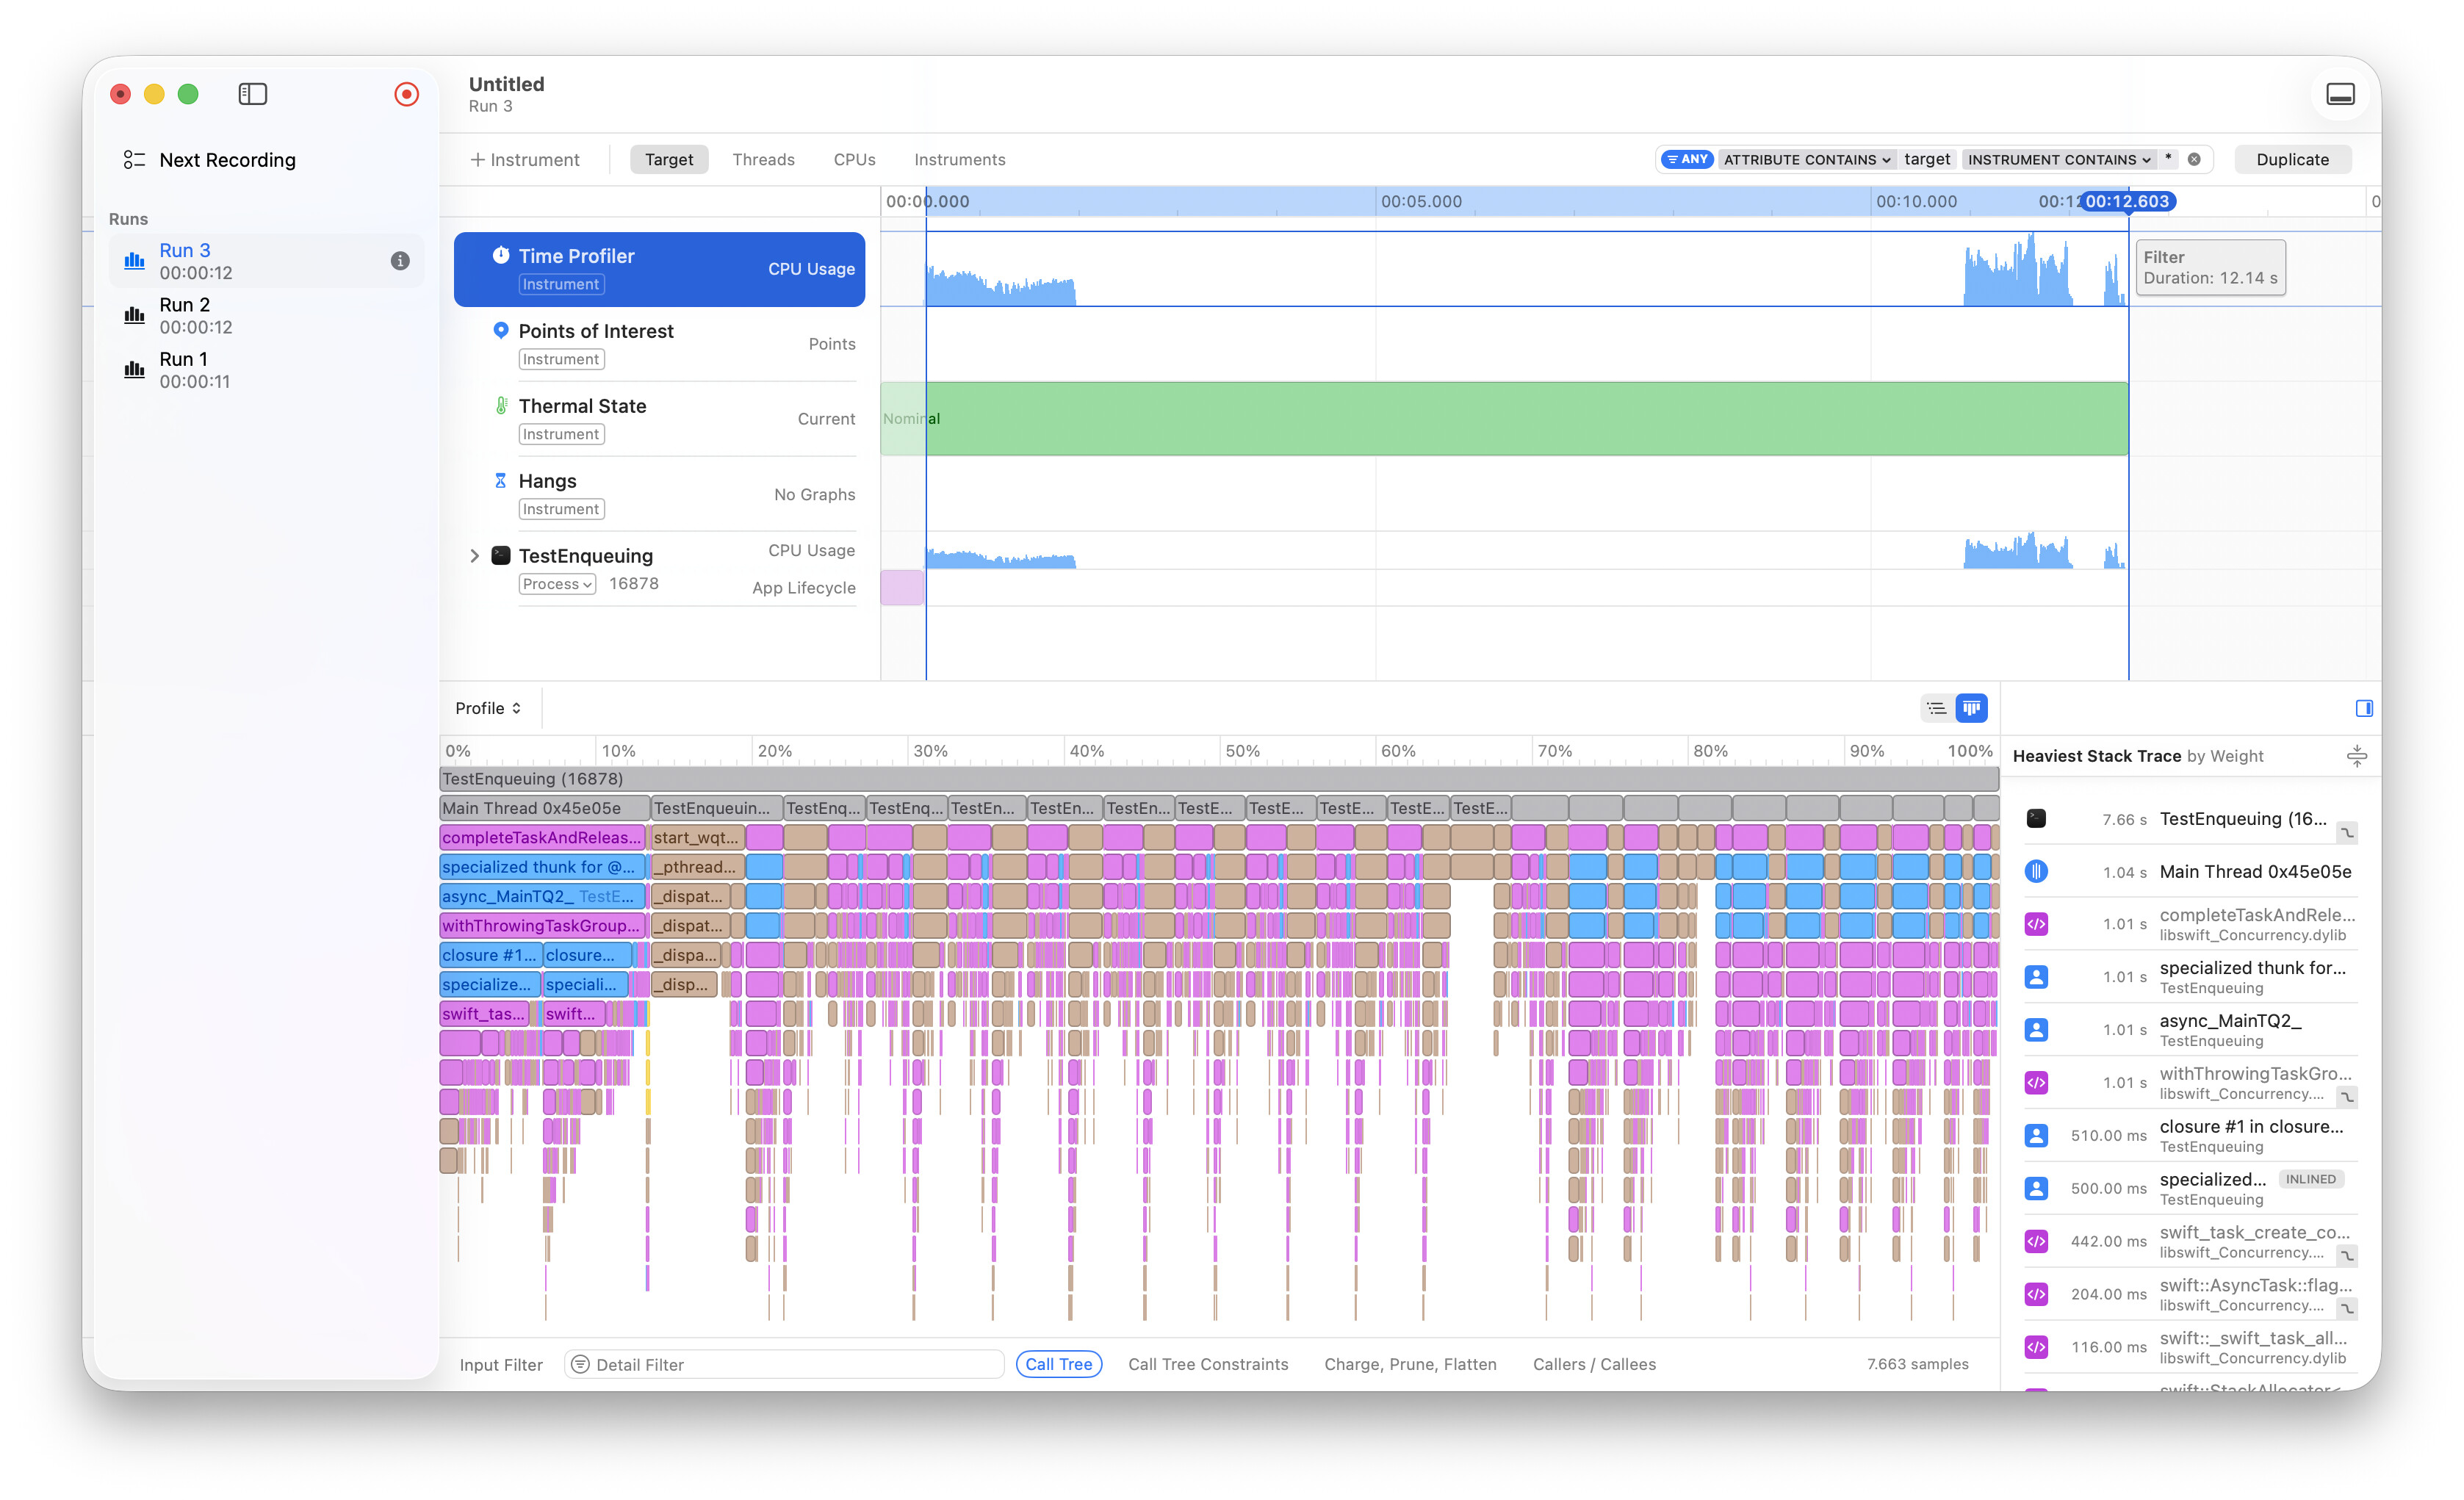
It runs in just 10.7s in Instruments.
Similarly, increasing the task count to 1M still completes in Instruments in 12.1 seconds!