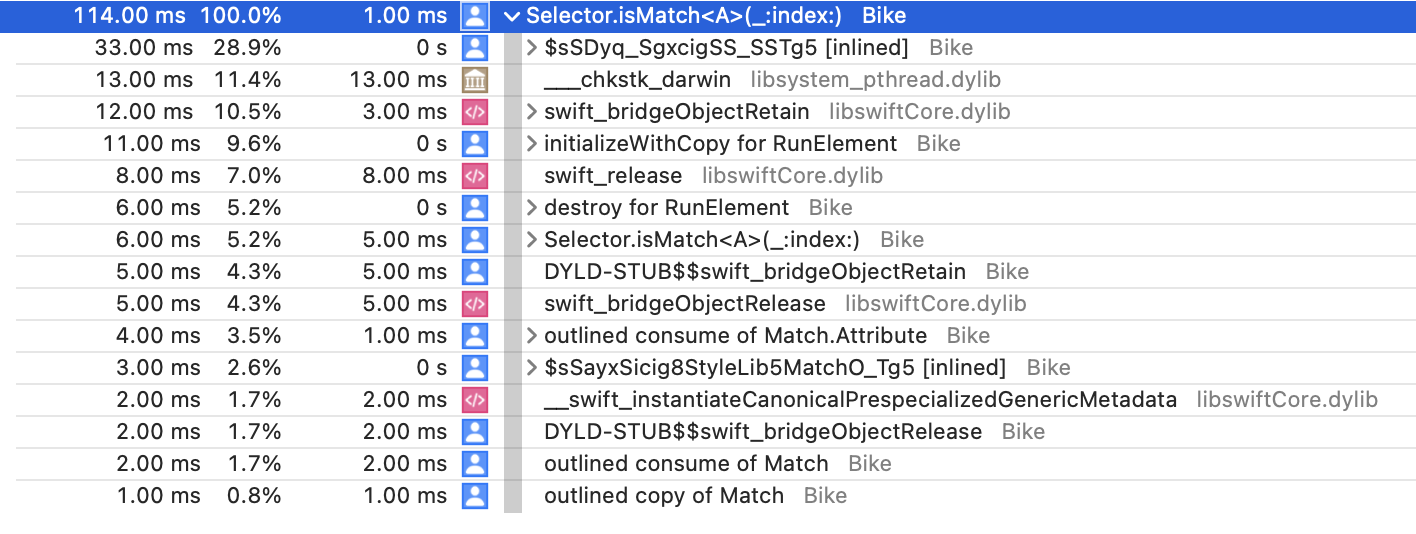
What is the initializeWithCopy for RunElement and destroy for RunElement code doing. Can I avoid it?
In this case RunElement is a struct conforming to Element. Is this because I'm using a struct? Would it be faster using a reference type?
Also what about swift_bridgeObjectRetain and release? I understand that swift needs to do retain count logic... but the "bridgeObject" label makes me wonder... does that mean this code is bridging to object-c? I expect this code to be all swift native, but maybe there's some bridging to object-c that I need to search for.
Where is this isMatch from? AFAICT Selector doesn't declare this. Are you matching an element in a collection? From what I can see this isMatch is calling through to Selector, which calls into the Obj-C runtime, unless you have a bunch of shadowed types here. We really need more context here.
Thanks for taking a look. I guess I will try using a class type instead and see if that makes a difference.
Also for anyone else looking at the profile, while the algorithm is recursive... in that profile there's no recursion happening... there are no .child or .descendant matches.