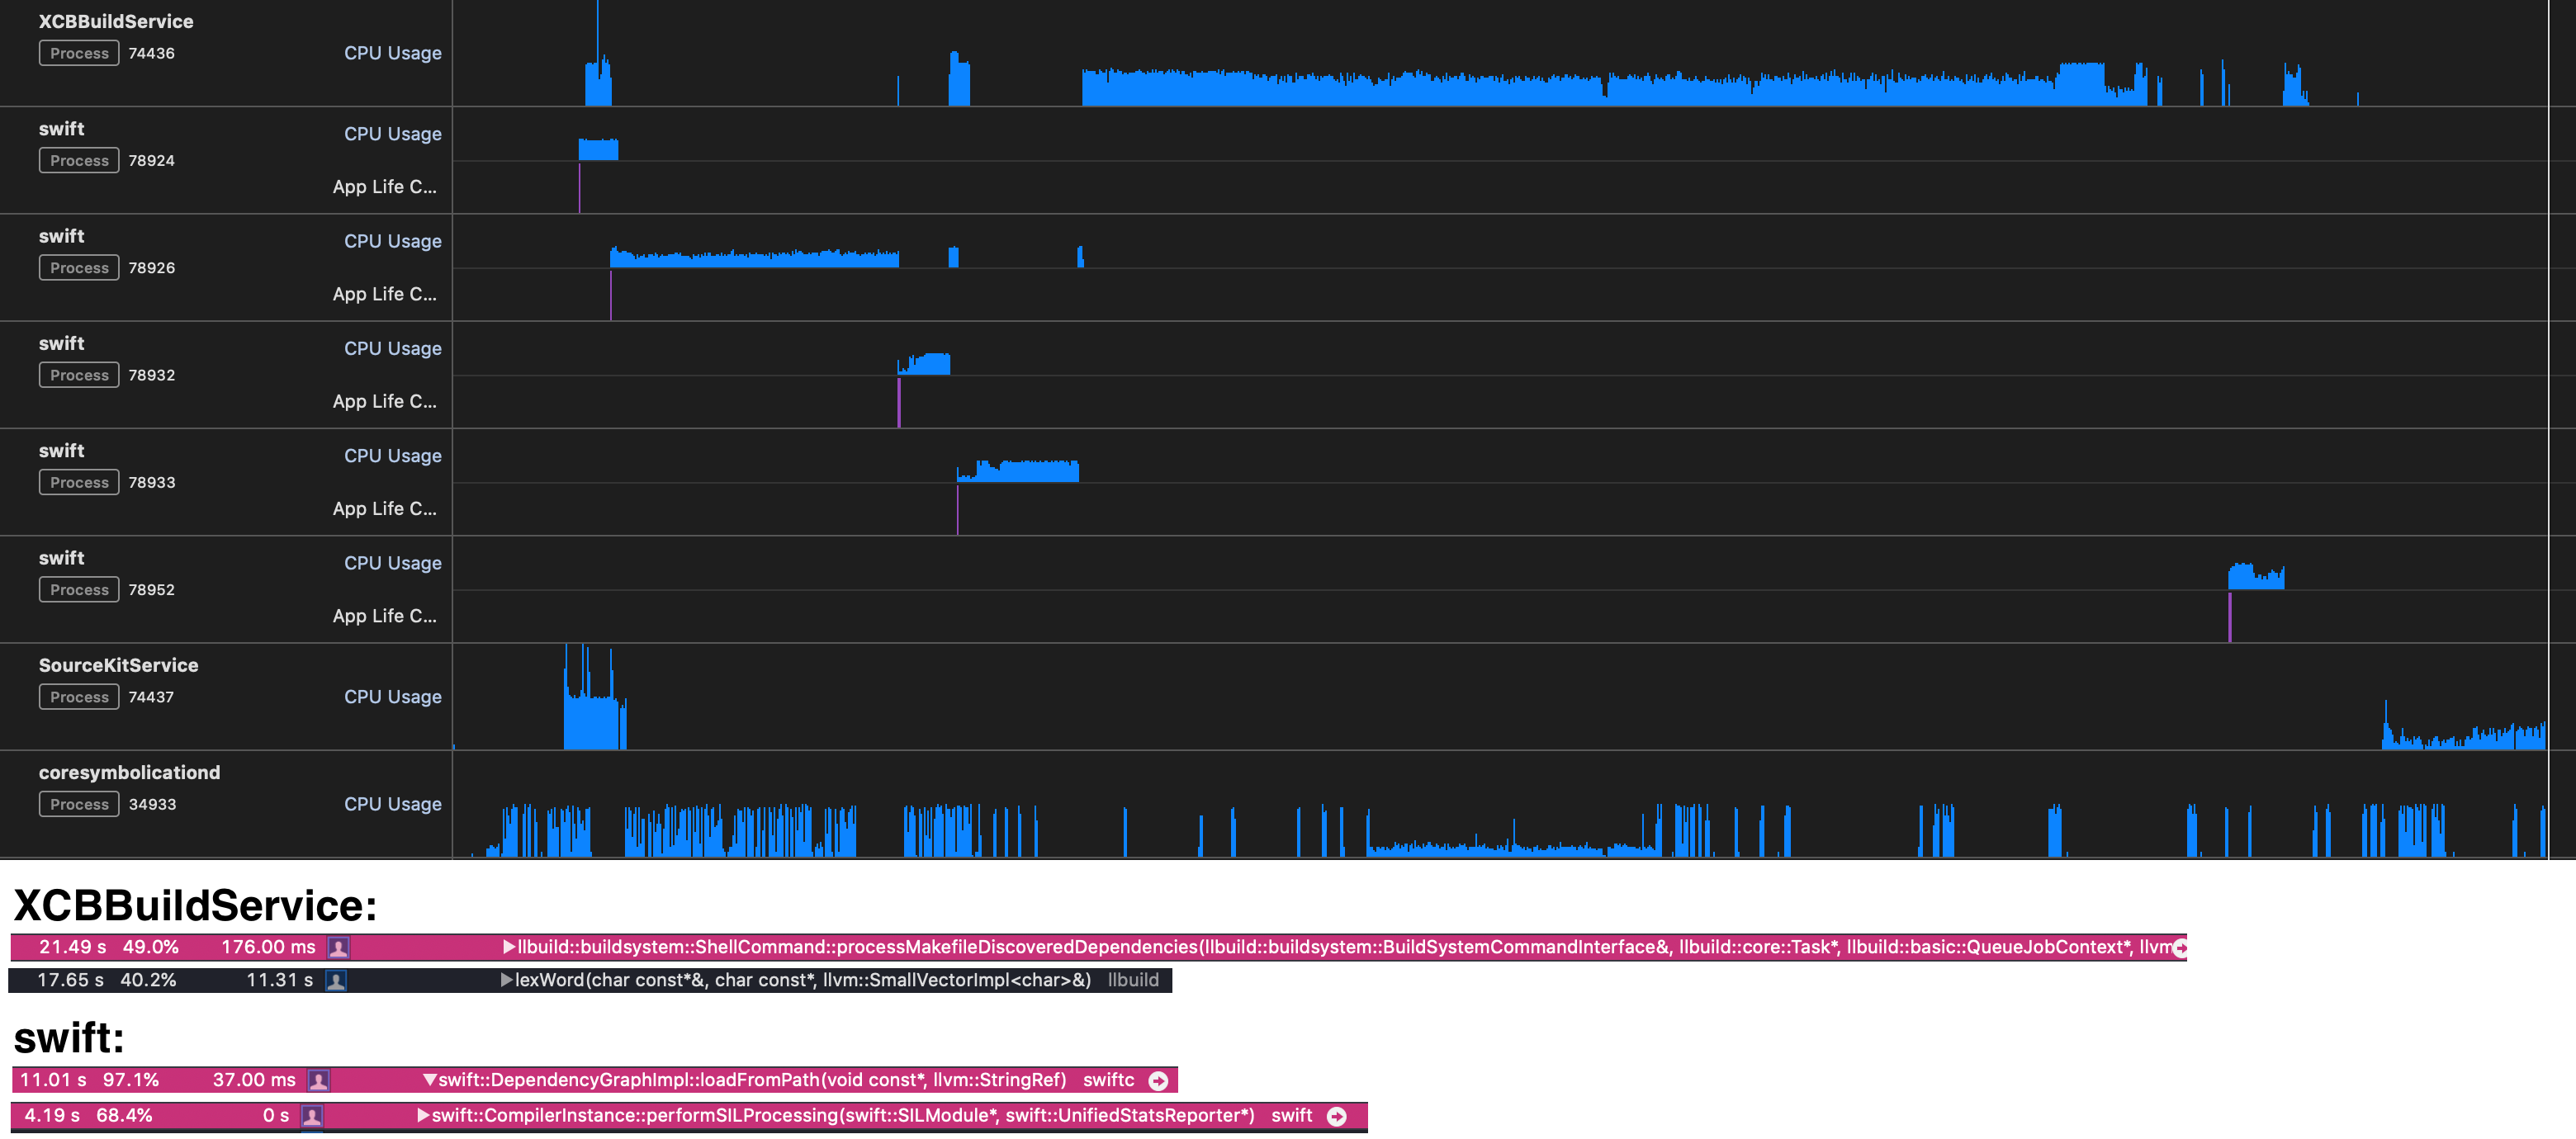
I work on an iOS project that has had a long-standing issue with incremental compile times. Making a change to the body of a private method results in a 90-120 second recompile. Using Instruments to see where the time is being spent pointed to the XCBBuildService process, which spends the most time in the ShellCommand::processMakefileDiscoveredDependencies function of llbuild (see attached graphic).
I'm a bit stuck on what to do with this information though. Could this be an issue in llbuild itself? Any advice would be appreciated!
Hey thanks for the reply! Whole module optimization is disabled on these builds. I took a look at some of the .d files for the project, and they do seem really big, but to be honest I'm not sure what they should normally look like. Is there anything in particular I should be looking for?
How many .swift files do you have in your biggest module?
.d (makefile dep files) files can be enormously big in large modules, and there a lot of them (one per .swift file). With a brief look at llbuild's depfile parser – i think there are some ways to improving its efficiency (compare with ninja). However, I haven't done any concrete performance measurements between those two.
I've also had experience with parsing that enormous amount of depfiles. We use ninja as our build system – it supports only one depfile per target, and swift compiler produces one depfile per .swift file – so we had to implement very efficient parser (similar to ninja) for them in our build script – even then it takes about 5s to parse all depfiles from biggest module (there are about 1000 .d files, each is parsed in ~3ms + ~2ms file reading time). Previously it was written on python and took about 40-50s. I've suggested to have single depfile per swift module – Single depfile for swiftpm target?, but didn't get any response for it.
Counting up the .d files for the main target, it looks like it has...about 1800 Swift files Quite a few, but is this kind of performance expected for such a large project?
As a side note, I updated to Xcode 11.3.1 yesterday, which includes a change to reduce the size of the .d files. Seems to have reduced our incremental build time by about 20 seconds which is nice.
but is this kind of performance expected for such a large project?
I don't know, but it is totally can be improved. Also – amount of parsing data grows n^2, as every depfile contains reference to all other sources :)
As a side note, I updated to Xcode 11.3.1 yesterday, which includes a change to reduce the size of the .d files. Seems to have reduced our incremental build time by about 20 seconds which is nice.
Yes, I was quite happy reading that in release notes, as it is just minor-minor update, but didn't make any measurements yet.
There is one other thing that drives me crazy – those depfile seems to be identical with the exception of "master" files. I've checked depfiles in our project, and it looks like that is actually the case, but because we don't have guarantees (I suppose llbuild developers don't have them either, as they parse them all) we need to do this completely useless work!