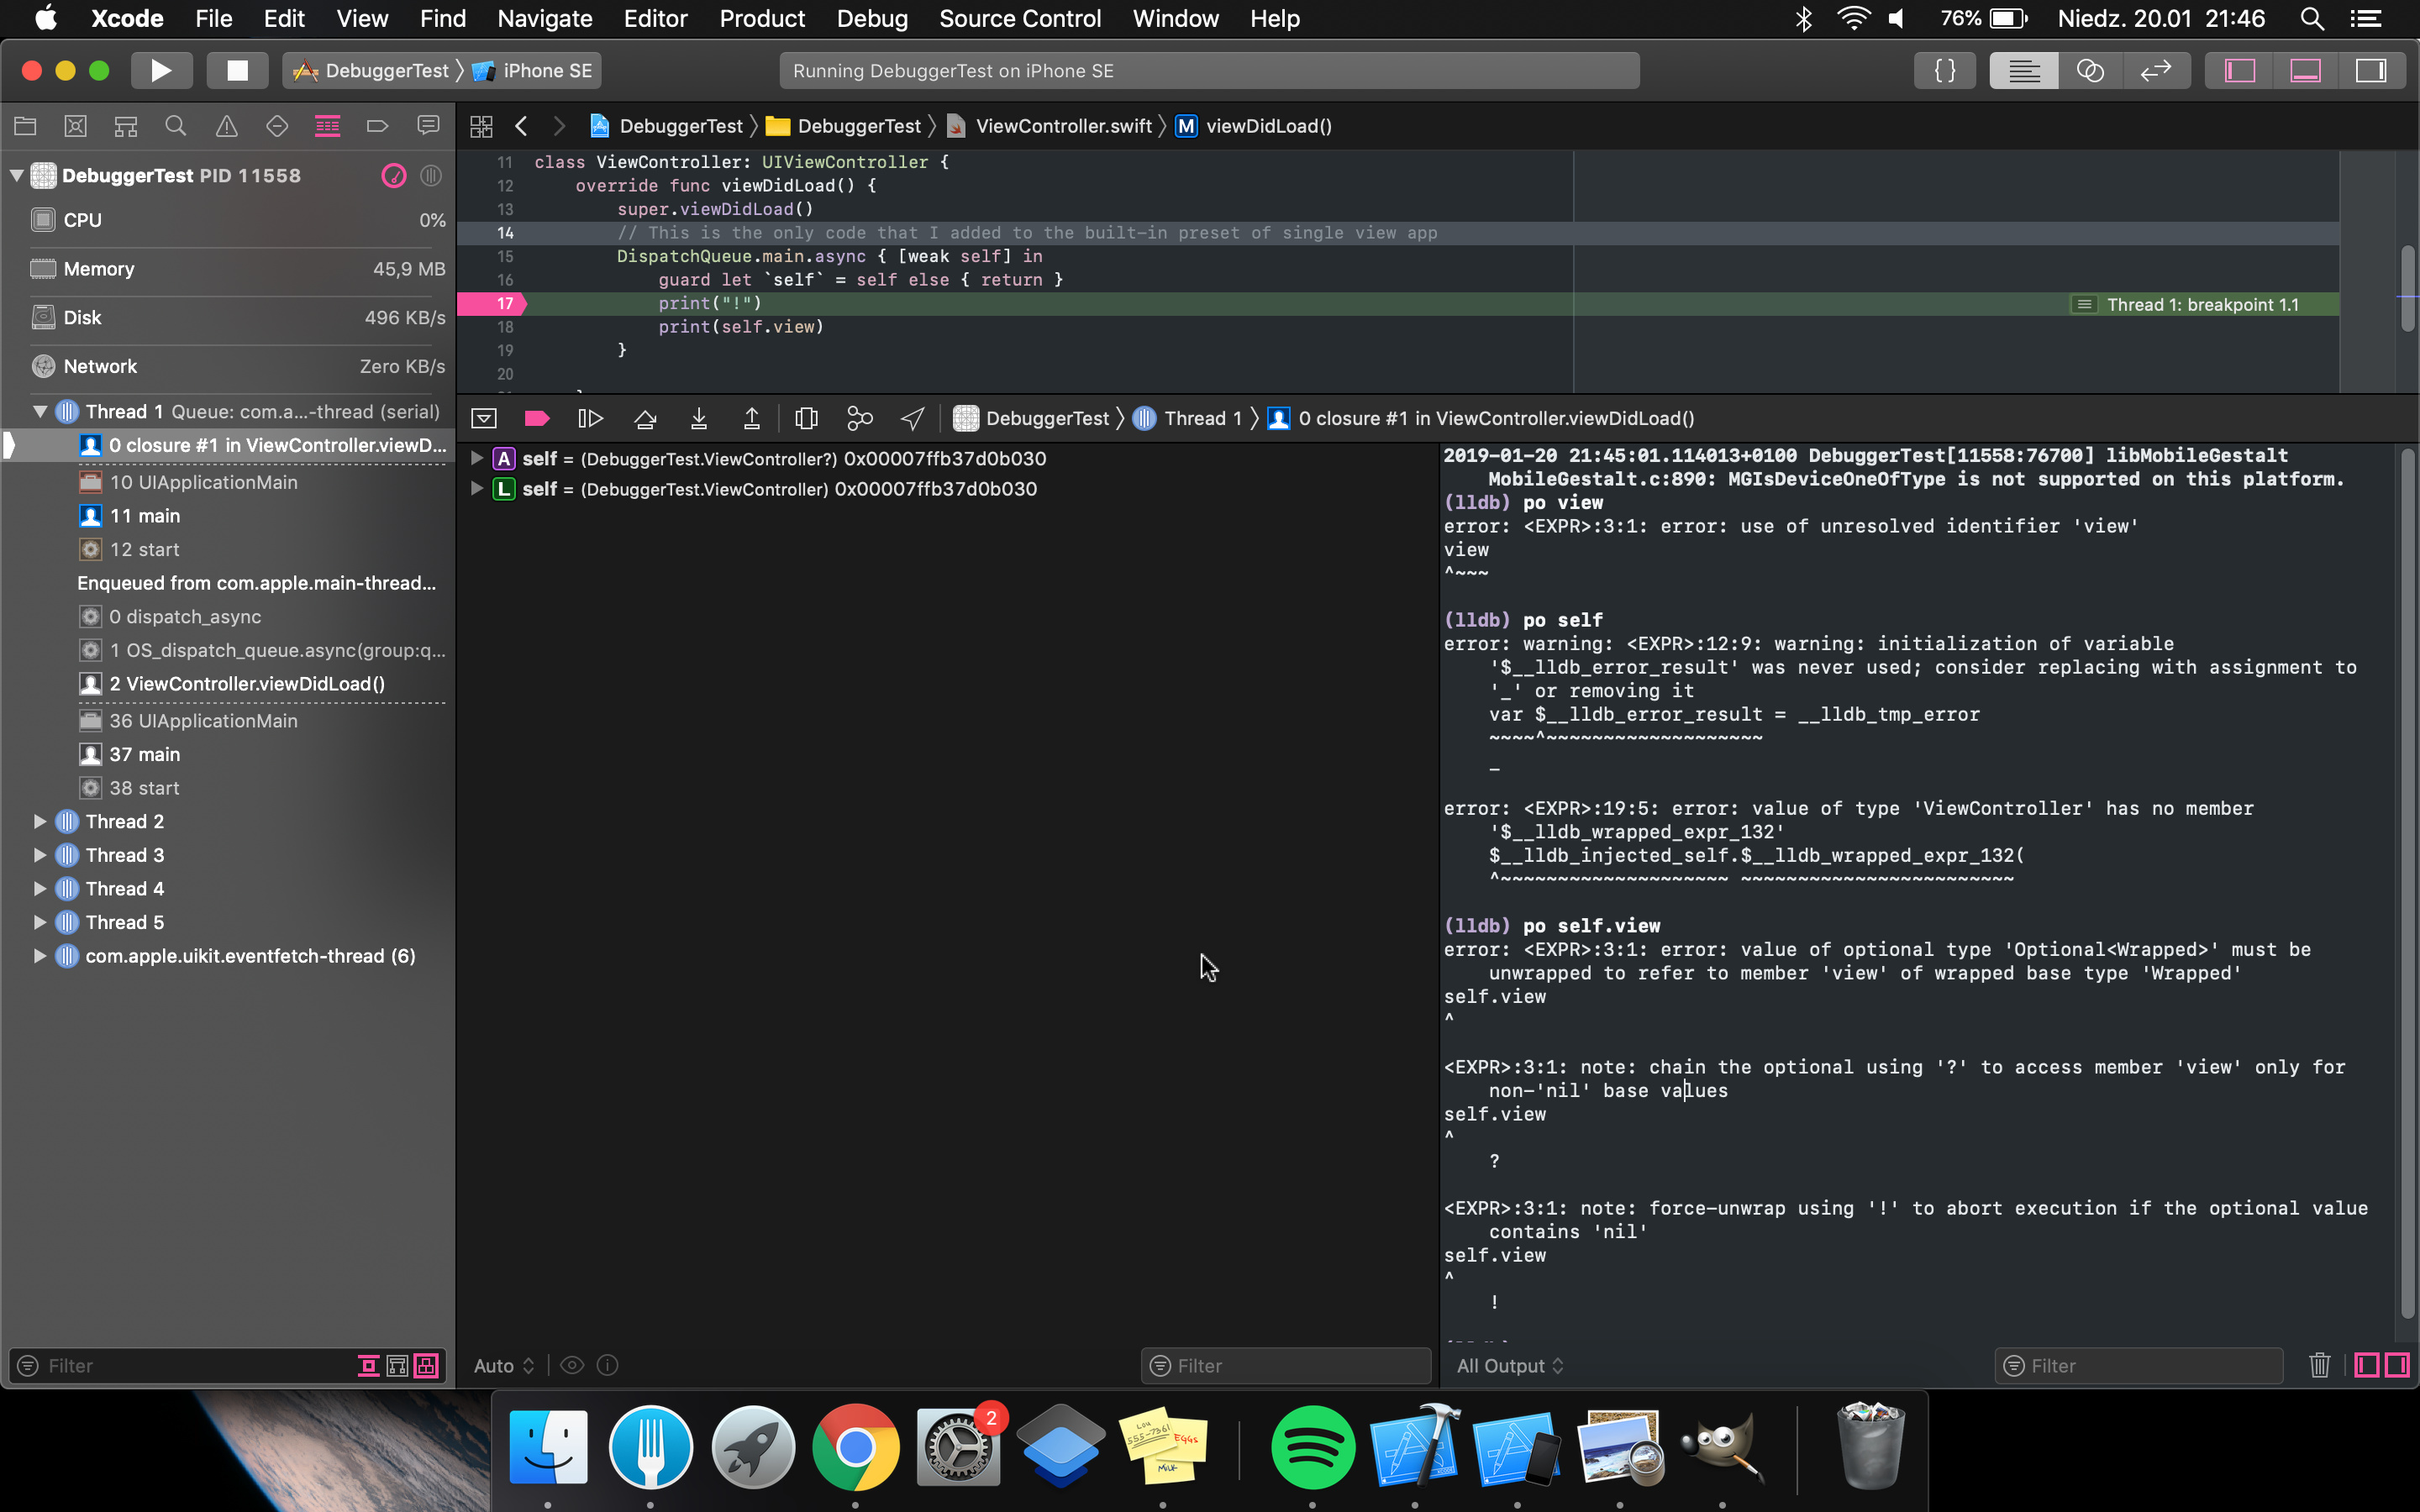
Example of mine. I stopped on line 68 and taken two steps. Sorry for not providing a simple, reproducible example, but in my experience printing stuff with a debugger is very hit and miss with no recognizable patterns, except one:
DispatchQueue.main.async { [weak self] in
    guard let self = self else { return }
    // stuff breaks here
}
Yes, I've seen similar issues. Despite very specific claims in the debugging sessions at WWDC '18, Xcode / lldb still has huge issues with breakpoints inside Swift closures and being unable to find captured values. However, I have found that printing all of the frame's variables (frame variable) will get me much of the same info, I just have to dig through a lot of irrelevant stuff.
But yes, the unreliable debugging experience is one of the biggest quality of life issues for Swift right now.
I just tried that on my example from earlier and unfortunately it gives me 5406 lines of irrelevant stuff followed by (NSAttributedString) messageText = <variable not available> :(
At least I have one more tool to use when debugger breaks! :)
Will do! (47417395 on apple bug reporter) Should I capture more examples of it happening in different places, or is one usually enough?
To clarify, I am not trying to do anything esoteric here. Just your most basic inspection of the values of properties, variables, structs, etc. Here is a screenshot for context:
We are looking at the body of an MTKView subclass. I am setting the value of various properties. Again, nothing fancy to see here.
In the panel - below left - where I should be able to inspect these values they are nowhere to be found. Just random hex values for memory addresses. WTF?!?!?
How on earth was this allowed to happen? How can you release a programming language without a suitable debugger? SMH.
Well, your variables view looks normal. and as you say the hex values (which are not random) are addresses. Addresses are often useful in debugging (even Swift). In this case most of the types you in your screenshot are Objective-C and in thus the address is literally the value of the variable.
It's unclear what you don't like about what you are seeing and/or what you are not seeing. If there's a property or local variable you don't see, what happens when you type "frame variable " in the console? Same thing with "p "? If there's any kind of error, can you provide us with the logs I requested above? Or better, a reproducer for your issue?
Above is a screenshot of a breakpoint set in a Javascript app. On the left is the source code and blue breakpoint. On the left in the "Scope" section are locally scopes items. Here I display the contents of the object named config. This is what a modern, debugger looks like in 2019.
Staring at hex values in a debugger in 2019 is about as archaic and primitive as it gets.
The only difference I can see between your javascript and Xcode examples is that there are no pointers in javascript. In both examples bools are printed as true/false, strings and numbers are printed as decimal numbers.
How would you represent a pointer if not as the address in hex?
I think the point was that the pointer address is literally the least interesting thing about those variables and there should be more useful defaults in Xcode, in addition to general reliability improvements. We shouldn’t have to print every variable in order to get useful information.
What kind of information? We already can see the type, and properties of the pointed object are available after clicking the triangle(as in the javascript example)
I'm looking at rdar://problem/47417395 right now. The symptoms for the messageText failure look like they could be a compiler rather than an LLDB issue. Could you locate the .o build artifact of the source file you are stopped in (or the .dSYM) and run xcrun dwarfdump --name tapAction -p -c [file.o/.dSYM]. And either post it here or attach it to the bugreport?
It looks like the debug info might be missing the location for messageText.
The easiest way to find the location is to look at the build log in Xcode and expand the swift compiler invocation for that source file. There should be a -o /path/to/file.o line in it.
The pointer entry in the locals is always the marker of the container of interesting things, you have to disclose it to see the actual contents. If the data type has some useful one line summary (e.g. the string value of an NSString *) then we show that, but if it doesn't, there isn't anything else useful to put there, so I'm not sure it does any harm to show the pointer value. It allows you to view the memory of the object, etc. So it is useful.
I guess your main point, however, is that when you disclose the container, you only see the ivars and you don't see the computed properties.
We don't as a rule show computed properties for any languages in the variables view in lldb. The reason is that to do that, for every stop the debugger has to make a function call into the debugee per property to fetch the values. That's fragile. For instance if a getter has side-effects (e.g. first time it's called it makes some backing object), then just stopping in the debugger can change the execution flow of your program which is not desirable. And if the getter does something complex like fetch data from a server, then that doesn't work at all well. The latter case requires some "don't present this property in the debugger" annotation, but then you have to know to apply that, and again it makes the whole experience more fragile.
It also slows down display of variable values considerably.
There's been a lot of discussion about this choice (which started with ObjC, BTW) over the years. I certainly see the desirability of showing computed properties. OTOH, I've been told both "other debuggers do this and it causes no problems" and "other debuggers do this and I have to turn it off because it causes lots of problems..." So while it would be definitely be interesting to experiment with adding computed properties to the variables display, it's not something to undertake lightly.
And if there's a property of an object that you really need to see, you can add it as an expression to the locals view. So there is a way to do this on-demand.
On the swift side, pure bridged Objc Objects only have computed properties. Given that we don't show computed properties, the most interesting thing to show for pure bridged ObjC objects is the ObjC side of the value.