Hi,
My co-worker @chiragramani had posted regarding the overheads of Macros in the past (Swift Macros: Build Time Overhead Concerns). This post is a deep-dive on looking at the exact overhead in one of the sample projects that he links to in this post.
Specifically, I take on the member-wise init macro example from his post and look into the process performance using Instruments. (MacroPerformanceRepro/WithMemberwiseInitMacro at main · chiragramani/MacroPerformanceRepro · GitHub)
This is the build graph without (top) and with (bottom) macros for essentially the same code:
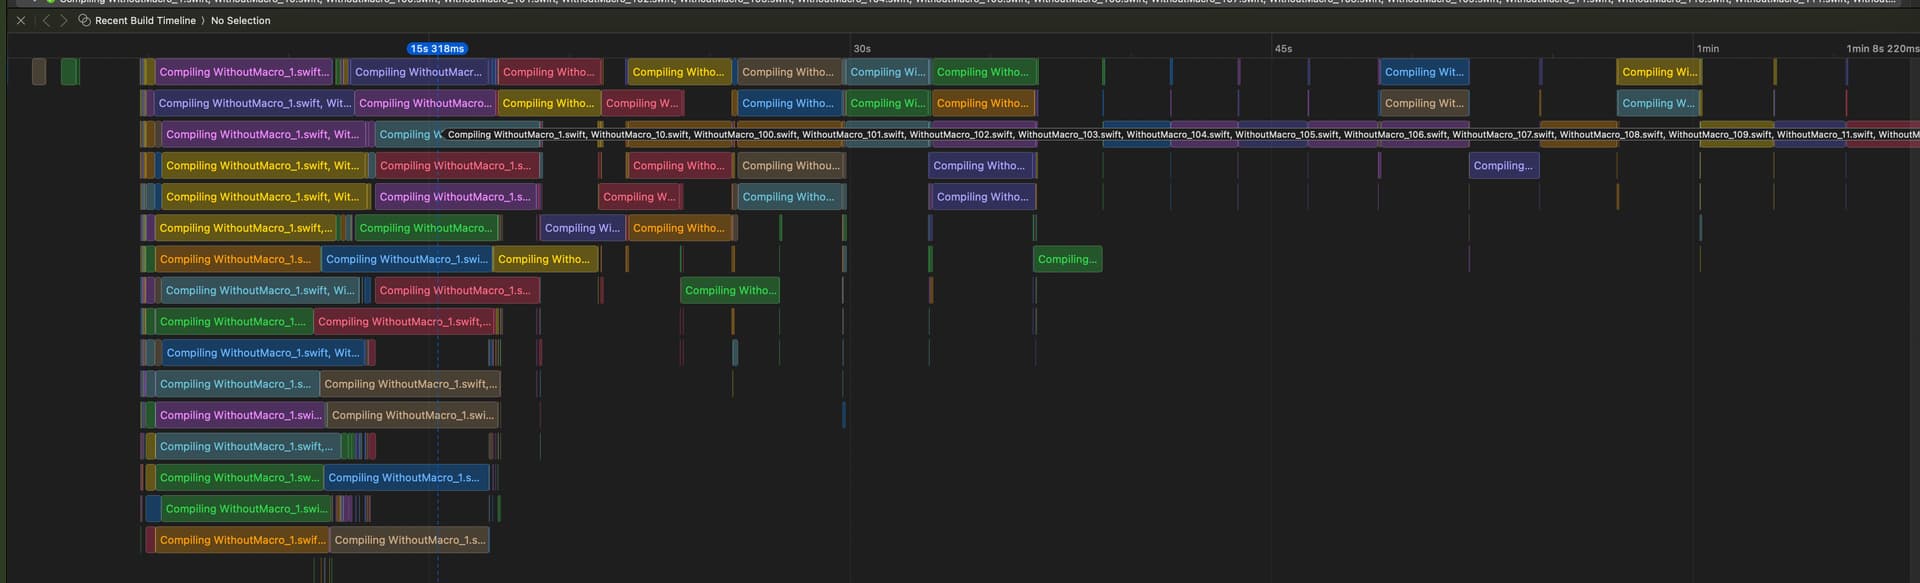
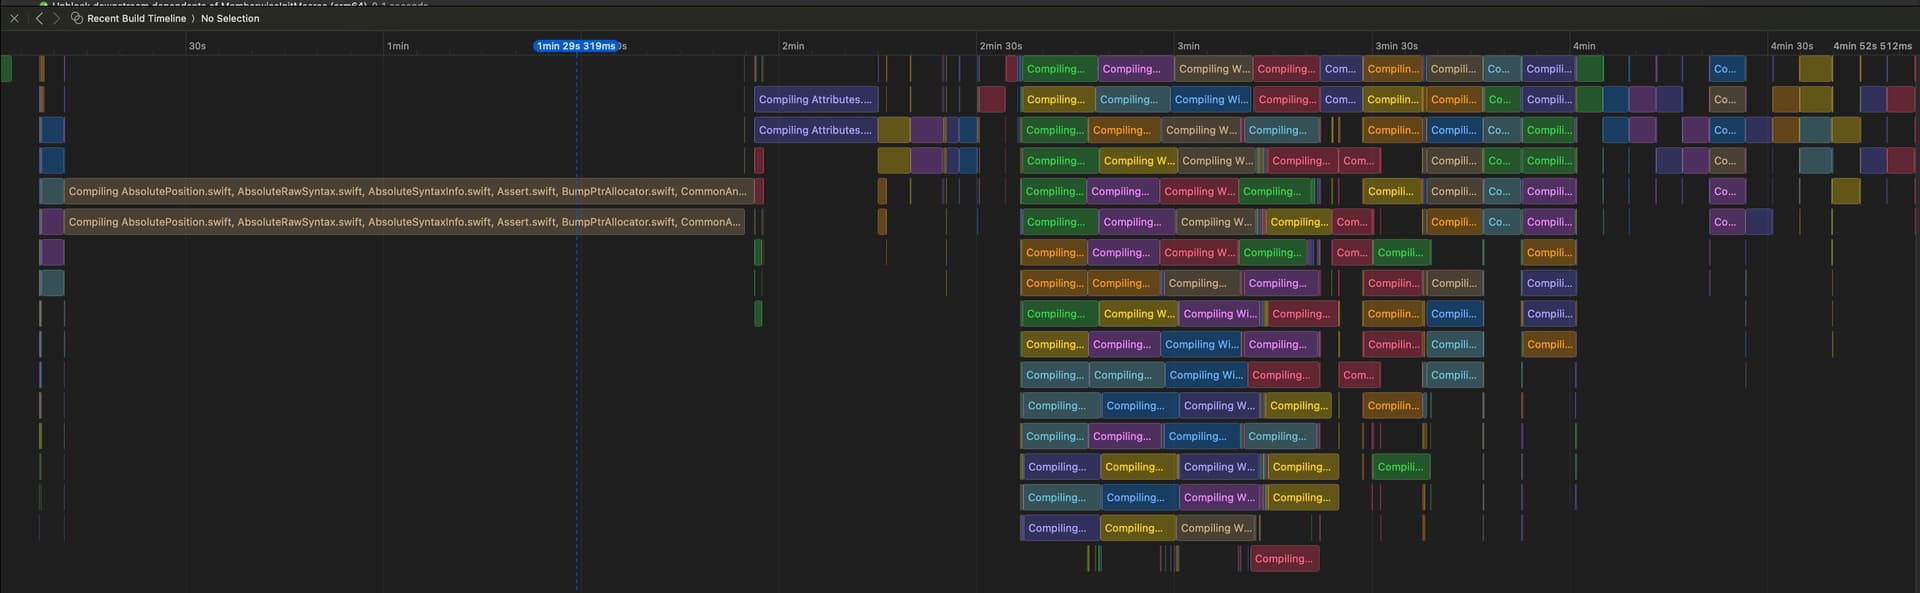
If we delete the time taken to compile SwiftSyntax (in Release mode), then we notice that the macro-based version of the code takes 50% more time to compile than the non-macro version.
Luckily, it seems that we don't really need the full project. We can actually compile just one module from this project and see the exact same 50% increase in compile time of that one module.
We can use instruments on the swift-frontend process to try and understand the slowdown. The version with macros (below) shows that there are 2 areas where we're not getting 100% samples during the run. Zooming into these areas we can see clearly that it's due to the compiler pausing and waiting for results (from the macro expansion process).
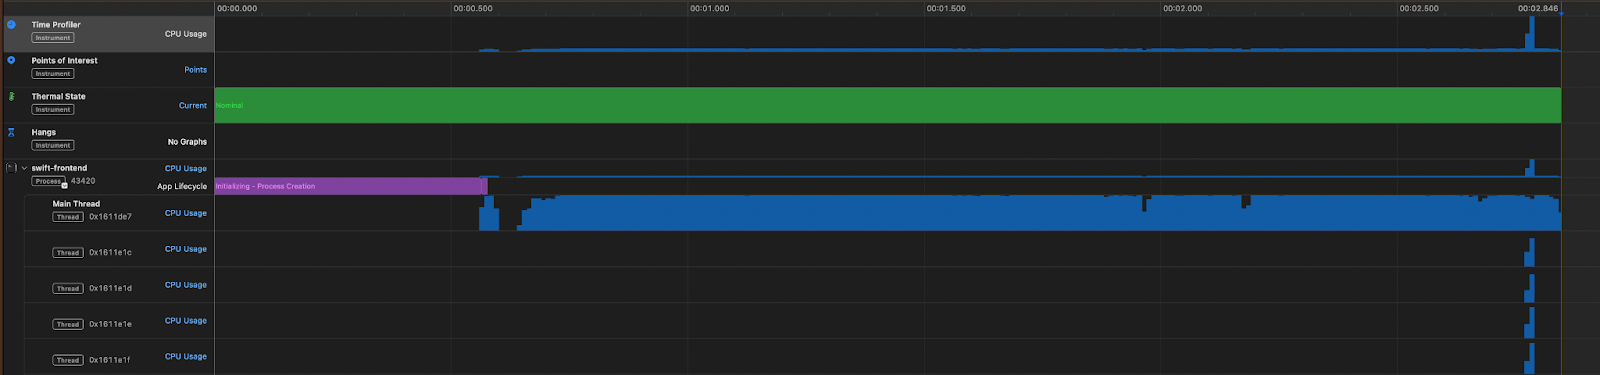

For the first "dip" we notice that the CPU usage is 60%, due to 40% of the time being spent waiting for the other process to expand the macro and return results. By sampling the compiler and the other process and zooming in, we can see then exact lockstep pattern where the compiler pauses while the other process works on expanding the macro.

In the non-macro case, looking at the compiler trace closely, we can see that it takes about 2ms per file to compile. In the macro case it increases to 5ms. Each file has 3 uses of the macro. We can see that (on average, the macro expansion time is directly proportional to the number of member variables in the class) each "round-trip" to the other process costs us about 1ms.
While the sample project pushes the number of uses of macros, this number we note above (1ms) is still a serious concern for us and our build times. As the swift-compiler has gotten faster over time (better apple silicon hardware, compiler code optimizations), a file compiles in just a few milliseconds. Adding about 1ms (or even 1/2 ms) for each use of a macro can quickly add up to a significant increase in compile time.
The second dip is due to all the many (hundreds in this case) of files written out a folder like : /System/Volumes/Data/private/var/folders/qt/3zlszpd57ssdd5gl891zx0540000gq/T/swift-generated-sources/ It's clear we need this expanded source for the debugger and other tools, but the sheer number of files (one per macro use) causes a real overhead for the compiler.
Note: We can initially speculated that launching the other (macro expansion) process over and over could have caused the overhead and maybe an in-process version might help. In the traces above, it's clear the process is only launched once per invocation of swift-fronted. It also seems that using stdio to communicate is not a serious bottleneck since only a small amount of text is sent back and forth.
We do not have any immediate solutions to propose here, this is just to let other people know about these findings.